HOT TOPICS LIST
- MACD
- Fibonacci
- RSI
- Gann
- ADXR
- Stochastics
- Volume
- Triangles
- Futures
- Cycles
- Volatility
- ZIGZAG
- MESA
- Retracement
- Aroon
INDICATORS LIST
LIST OF TOPICS
PRINT THIS ARTICLE
by Koos van der Merwe
"Facebook is undervalued," so said Jon Najarian on CNBC, last Friday morning.
Position: Accumulate
Koos van der Merwe
Has been a technical analyst since 1969, and has worked as a futures and options trader with First Financial Futures in Johannesburg, South Africa.
PRINT THIS ARTICLE
TECHNICAL ANALYSIS
Is Facebook Undervalued?
11/23/16 03:44:44 PMby Koos van der Merwe
"Facebook is undervalued," so said Jon Najarian on CNBC, last Friday morning.
Position: Accumulate
| Jon Najarian, a professional investor, chats on CNBC Fast Money, with his twin brother Pete every morning. On Friday, November 18th, he commented that in his opinion, shares of Facebook are undervalued. Jon is an option trader, so he has probably bought calls on Facebook, believing that over the next few months the share price should rise. On Wednesday, November 16th, Facebook admitted more problems with its ad products — that it has been miscounting views on four of them. The share price hardly dropped on this news, having already fallen from a high of $133 on October 24th to its present price of $110. Looking at technical analysis, is the share now a buy? |

|
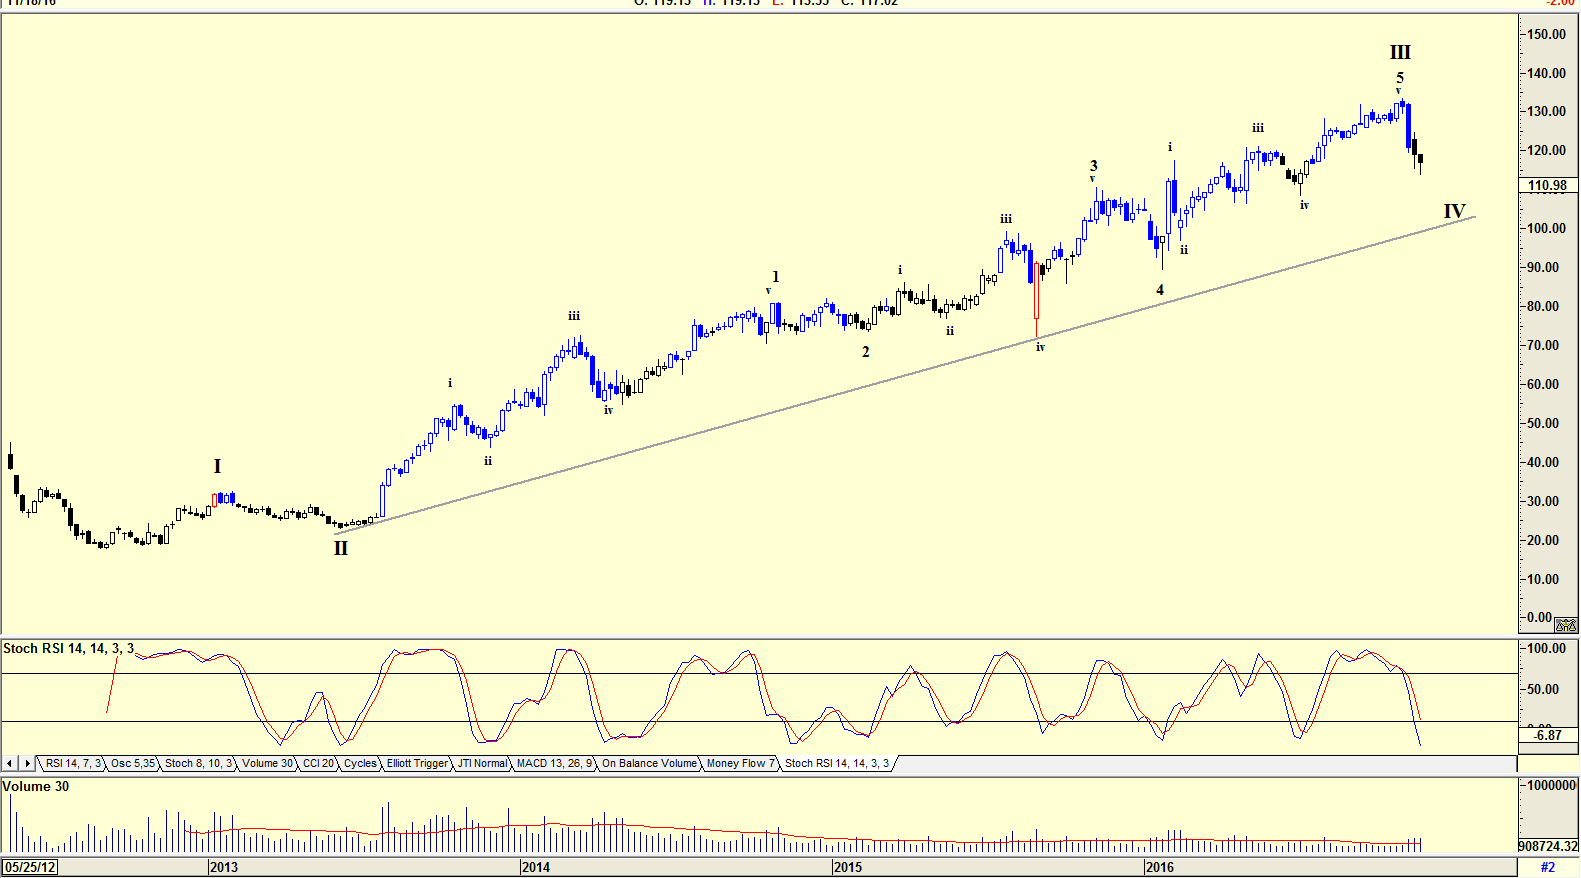
| Figure 1. Weekly chart of Facebook with Elliott wave count. |
| Graphic provided by: AdvancedGET. |
| |
| The chart in Figure 1 is a weekly chart of Facebook with an Elliott wave count suggesting that the share price is tracing a WAVE IV. The target suggested by the support line is $113.32. The Stochastic RSI indicator is at oversold levels and could be suggesting a BUY in the near future. However, a look at the volume shows that volume increased over the past few weeks as the share price dropped, suggesting that there may be further weakness ahead. |

|
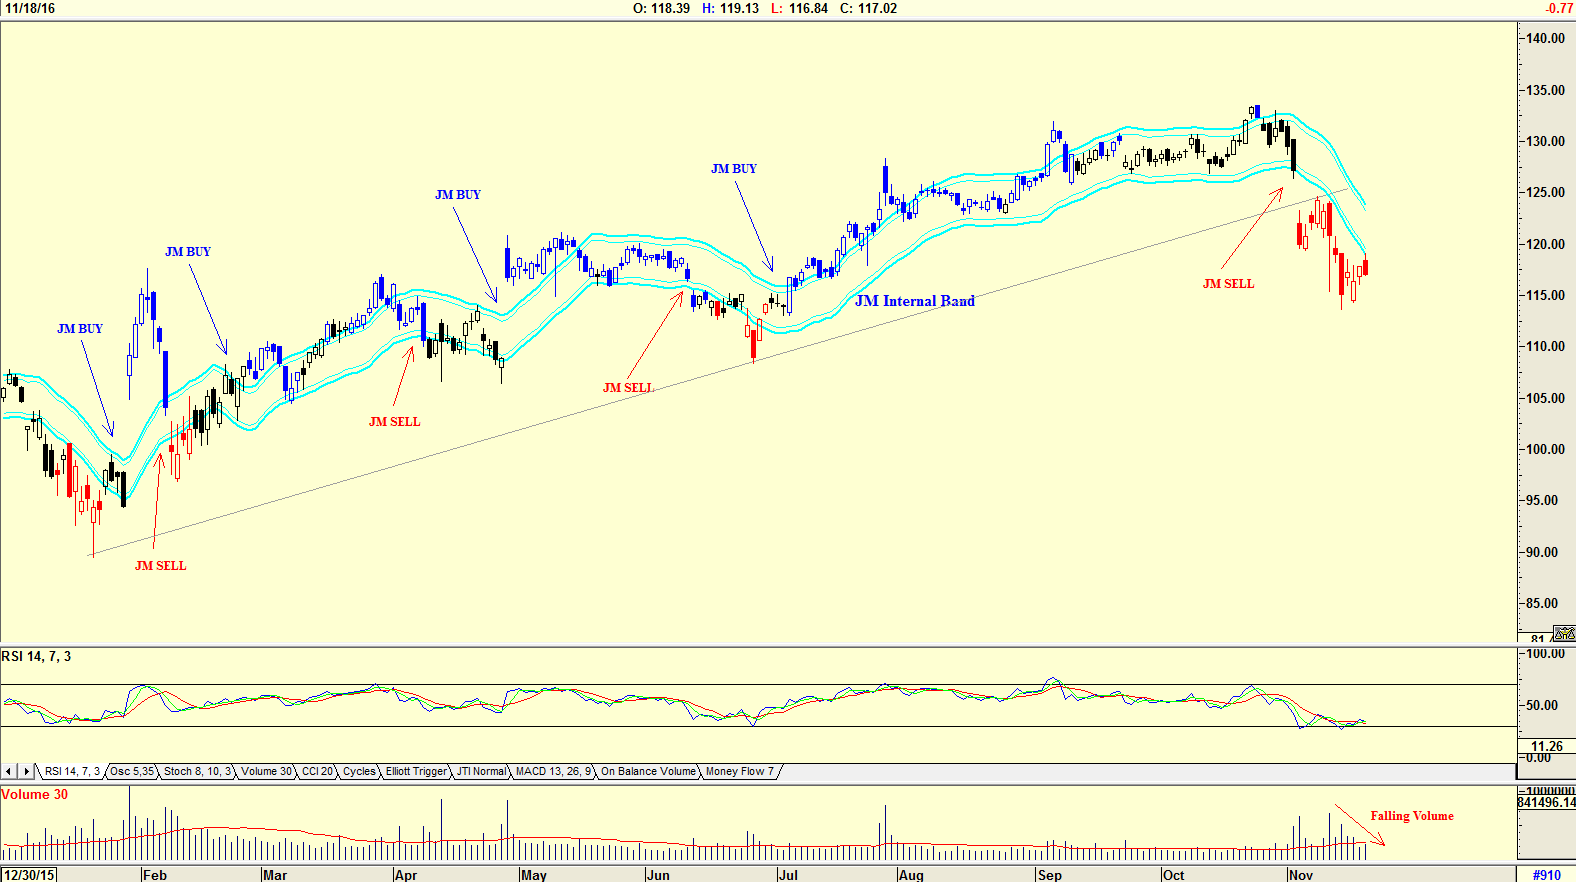
| Figure 2. Daily chart of Facebook with JM Internal Band. |
| Graphic provided by: AdvancedGET. |
| |
| The daily chart in Figure 2 is a daily chart with a JM Internal Band. A JM Internal Band is a simple 15 period moving average offset by 2% plus and 2% minus. A move above the upper band suggests a buy, and below the lower band a sell. At the moment, the share price is in a sell mode as shown on the chart. The RSI 14-period indicator has suggested a buy. Volume started falling as the share price dropped suggesting a reversal in the near future. Falling volume with a falling price suggests a rise in price. |

|
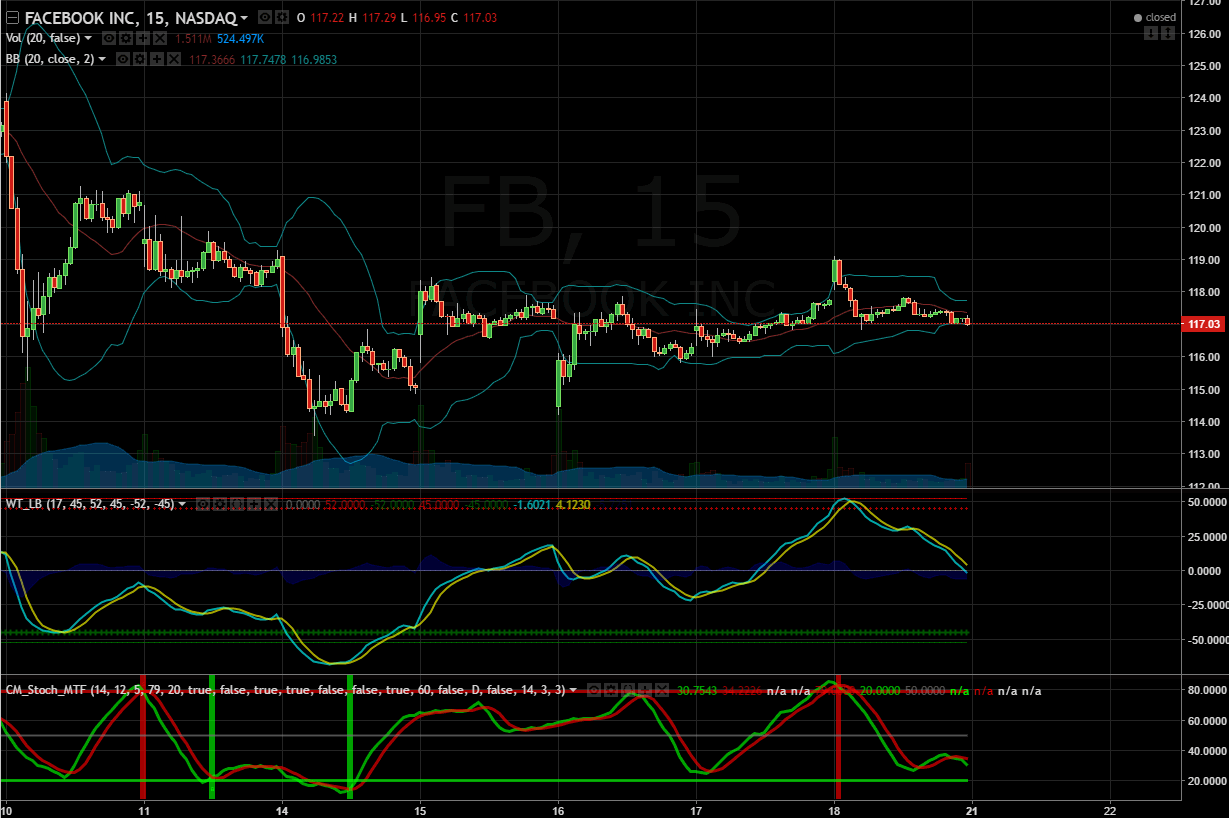
| Figure 3. 15-minute chart of Facebook with propriety indicators. |
| Graphic provided by: TradingView. |
| |
| The chart in Figure 3 is a 15-minute intraday chart showing Bollinger bands, and two indicators developed by users of the intraday share analysis program Tradingview. Both indicators are still suggesting weakness. Reports on the movement of a share by fundamentalists in news channels should always be checked with technical analysis. Traders could take the risk of buying with the RSI indicator suggesting a buy in the daily charts, looking at intraday charts to confirm a buy. Investors could wait for a JM Internal Band buy signal. |
Has been a technical analyst since 1969, and has worked as a futures and options trader with First Financial Futures in Johannesburg, South Africa.
| Address: | 3256 West 24th Ave |
| Vancouver, BC | |
| Phone # for sales: | 6042634214 |
| E-mail address: | petroosp@gmail.com |
Click here for more information about our publications!
PRINT THIS ARTICLE

Request Information From Our Sponsors
- StockCharts.com, Inc.
- Candle Patterns
- Candlestick Charting Explained
- Intermarket Technical Analysis
- John Murphy on Chart Analysis
- John Murphy's Chart Pattern Recognition
- John Murphy's Market Message
- MurphyExplainsMarketAnalysis-Intermarket Analysis
- MurphyExplainsMarketAnalysis-Visual Analysis
- StockCharts.com
- Technical Analysis of the Financial Markets
- The Visual Investor
- VectorVest, Inc.
- Executive Premier Workshop
- One-Day Options Course
- OptionsPro
- Retirement Income Workshop
- Sure-Fire Trading Systems (VectorVest, Inc.)
- Trading as a Business Workshop
- VectorVest 7 EOD
- VectorVest 7 RealTime/IntraDay
- VectorVest AutoTester
- VectorVest Educational Services
- VectorVest OnLine
- VectorVest Options Analyzer
- VectorVest ProGraphics v6.0
- VectorVest ProTrader 7
- VectorVest RealTime Derby Tool
- VectorVest Simulator
- VectorVest Variator
- VectorVest Watchdog
