HOT TOPICS LIST
- MACD
- Fibonacci
- RSI
- Gann
- ADXR
- Stochastics
- Volume
- Triangles
- Futures
- Cycles
- Volatility
- ZIGZAG
- MESA
- Retracement
- Aroon
INDICATORS LIST
LIST OF TOPICS
PRINT THIS ARTICLE
by Gary Grosschadl
Positive and negative divergences often lead to predictable moves, as this chart of Canada's largest bank shows.
Position: Sell
Gary Grosschadl
Independent Canadian equities trader and technical analyst based in Peterborough
Ontario, Canada.
PRINT THIS ARTICLE
CHART ANALYSIS
Royal Bank's Divergent Swings
11/27/02 12:06:13 PMby Gary Grosschadl
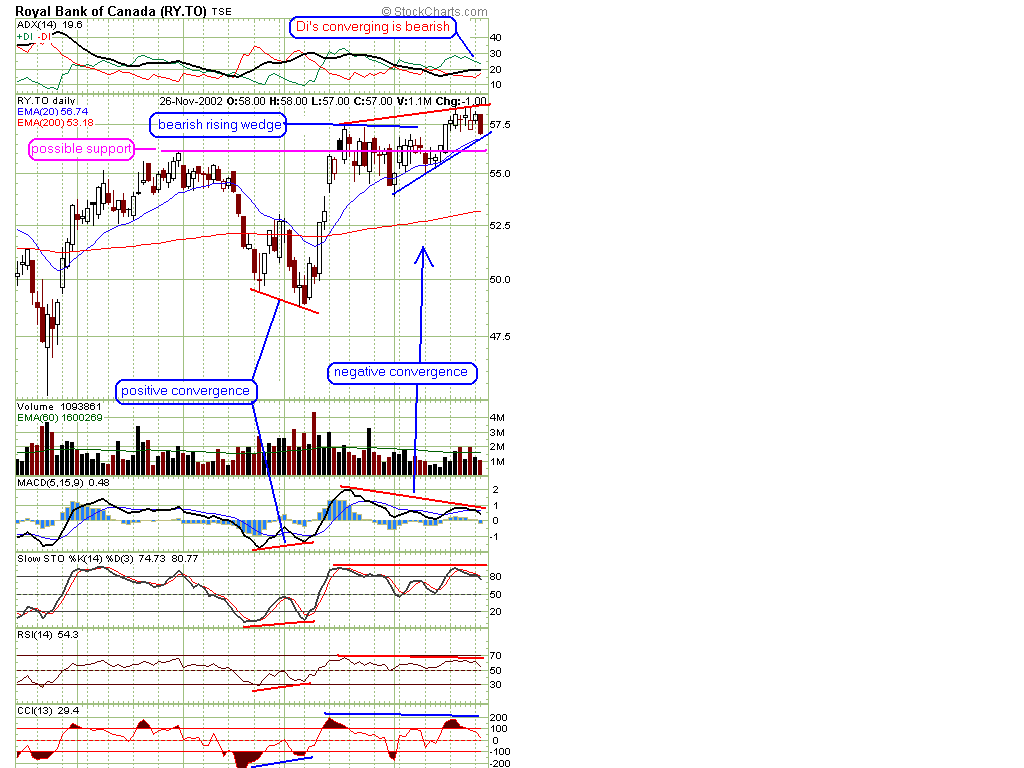
Positive and negative divergences often lead to predictable moves, as this chart of Canada's largest bank shows.
Position: Sell
| As the middle of the chart shows, the stock made a lower low but several indicators did not. This resulted in a positive divergence, as there was no confirmation that the lower price would hold. I often prefer to use the MACD indicator to show divergence, but we can see this on other indicators as well, and this serves as additional confirmation. The chart shows RSI, stochastics, and CCI indicators also showing divergences. |
| Now with the stock recently flirting with new highs, we see another divergence - the opposite of the previous one, as it's a negative divergence to price action. As the stock made recent new highs, the MACD (and other indicators) did not. The MACD indicator illustrates this rather well in this case. This throws doubt on what the price action is saying (even before today's bearish candle). |

|
| Graphic provided by: stockcharts.com. |
| |
| This chart also shows a bearish rising wedge formation. With today's bearish action on the indices, this stock faltered and looks to break down out of this wedge. Initial support might occur at the horizontal line (as shown), which lines up with the base of a previous large candle, a previous gap area further back, and a previous high. With further bearishness, the decline may come down as far as the 200-period EMA near $53, which by measurement fulfills the bearish wedge decline. |
| Traders are well served by noting divergences, because they can work both ways, helping both bulls and bears with trading targets. As always, look for additional evidence to give credence to your observations, such as pattern recognition. |
Independent Canadian equities trader and technical analyst based in Peterborough
Ontario, Canada.
| Website: | www.whatsonsale.ca/financial.html |
| E-mail address: | gwg7@sympatico.ca |
Click here for more information about our publications!
Comments
Date: 11/30/02Rank: 2Comment:

Request Information From Our Sponsors
- StockCharts.com, Inc.
- Candle Patterns
- Candlestick Charting Explained
- Intermarket Technical Analysis
- John Murphy on Chart Analysis
- John Murphy's Chart Pattern Recognition
- John Murphy's Market Message
- MurphyExplainsMarketAnalysis-Intermarket Analysis
- MurphyExplainsMarketAnalysis-Visual Analysis
- StockCharts.com
- Technical Analysis of the Financial Markets
- The Visual Investor
- VectorVest, Inc.
- Executive Premier Workshop
- One-Day Options Course
- OptionsPro
- Retirement Income Workshop
- Sure-Fire Trading Systems (VectorVest, Inc.)
- Trading as a Business Workshop
- VectorVest 7 EOD
- VectorVest 7 RealTime/IntraDay
- VectorVest AutoTester
- VectorVest Educational Services
- VectorVest OnLine
- VectorVest Options Analyzer
- VectorVest ProGraphics v6.0
- VectorVest ProTrader 7
- VectorVest RealTime Derby Tool
- VectorVest Simulator
- VectorVest Variator
- VectorVest Watchdog
