HOT TOPICS LIST
- MACD
- Fibonacci
- RSI
- Gann
- ADXR
- Stochastics
- Volume
- Triangles
- Futures
- Cycles
- Volatility
- ZIGZAG
- MESA
- Retracement
- Aroon
INDICATORS LIST
LIST OF TOPICS
PRINT THIS ARTICLE
by Koos van der Merwe
We all know the Nike brand, founded in 1964 as Blue Ribbon Sports, and changing its name to Nike in 1971.
Position: Accumulate
Koos van der Merwe
Has been a technical analyst since 1969, and has worked as a futures and options trader with First Financial Futures in Johannesburg, South Africa.
PRINT THIS ARTICLE
TECHNICAL ANALYSIS
Nike, Inc.
11/16/16 03:25:05 PMby Koos van der Merwe
We all know the Nike brand, founded in 1964 as Blue Ribbon Sports, and changing its name to Nike in 1971.
Position: Accumulate
| Nike, Inc. is an American multinational corporation engaged in the design, development and worldwide marketing and sales of footwear, apparel, equipment, accessories and services. The company is an inspiration and innovation for every athlete in the world. |

|
| Figure 1. Monthly Chart. |
| Graphic provided by: AdvancedGET. |
| |
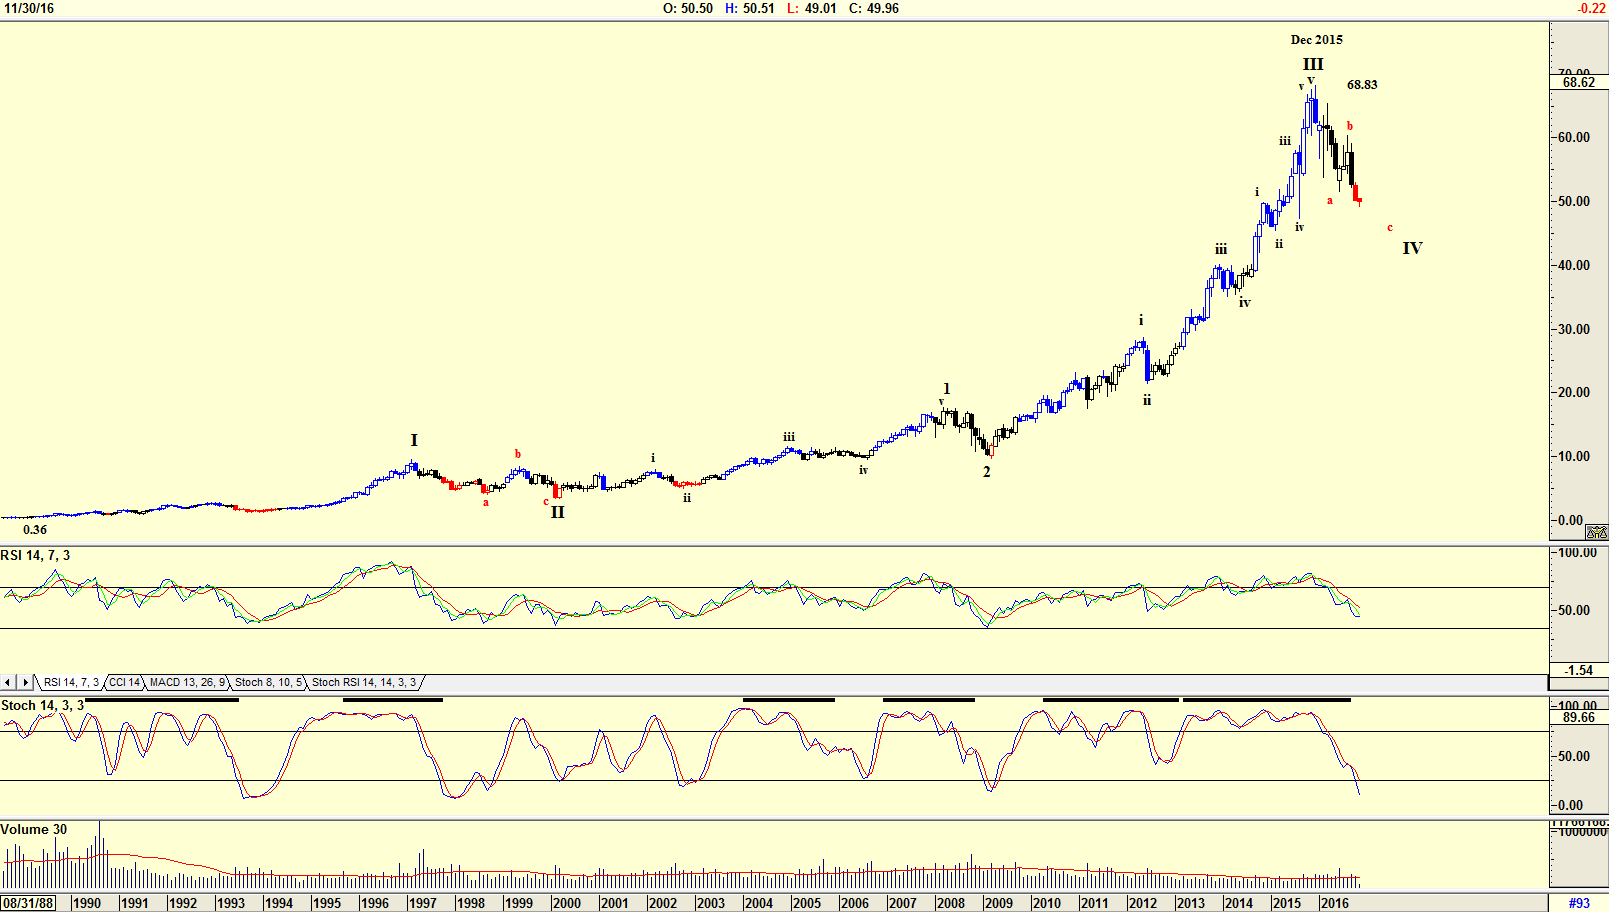
| The chart in Figure 1 is a monthly chart and shows how the share price moved from a low of $0.36 in 1989 to a high of $68.83 by December 2015. The year 2016 has not been kind to the share price, which has fallen to its present price of $49.96. The Elliott wave count is suggesting that the share is in a WAVE IV correction with the RSI 14 and Stochastic 14 both suggesting that a buy signal will be given in the near future. |

|
| Figure 2. Weekly Chart. |
| Graphic provided by: AdvancedGET. |
| |
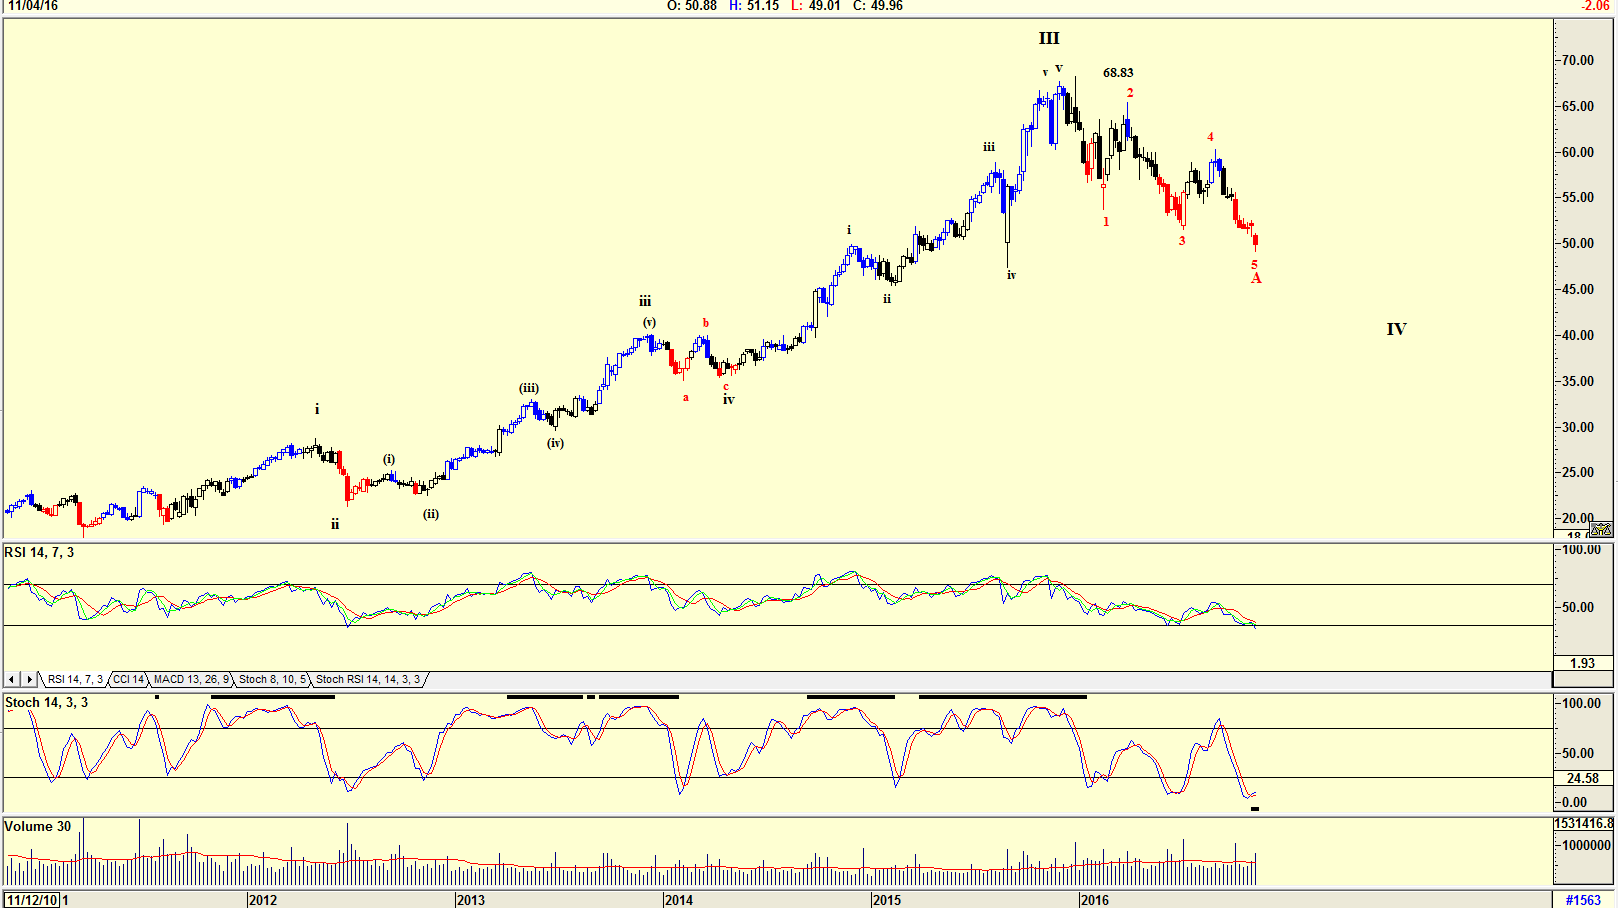
| The chart in Figure 2 is a weekly chart confirming a buy signal in the near future. Both indicators have given buy signals, suggesting that the share price should start moving up. Elliott wave count is suggesting that the share price is in a WAVE A, but this count could be the WAVE IV, with a WAVE V to follow. Either way, the share price should start rising. |

|
| Figure 3. Daily Chart. |
| Graphic provided by: AdvancedGET. |
| |
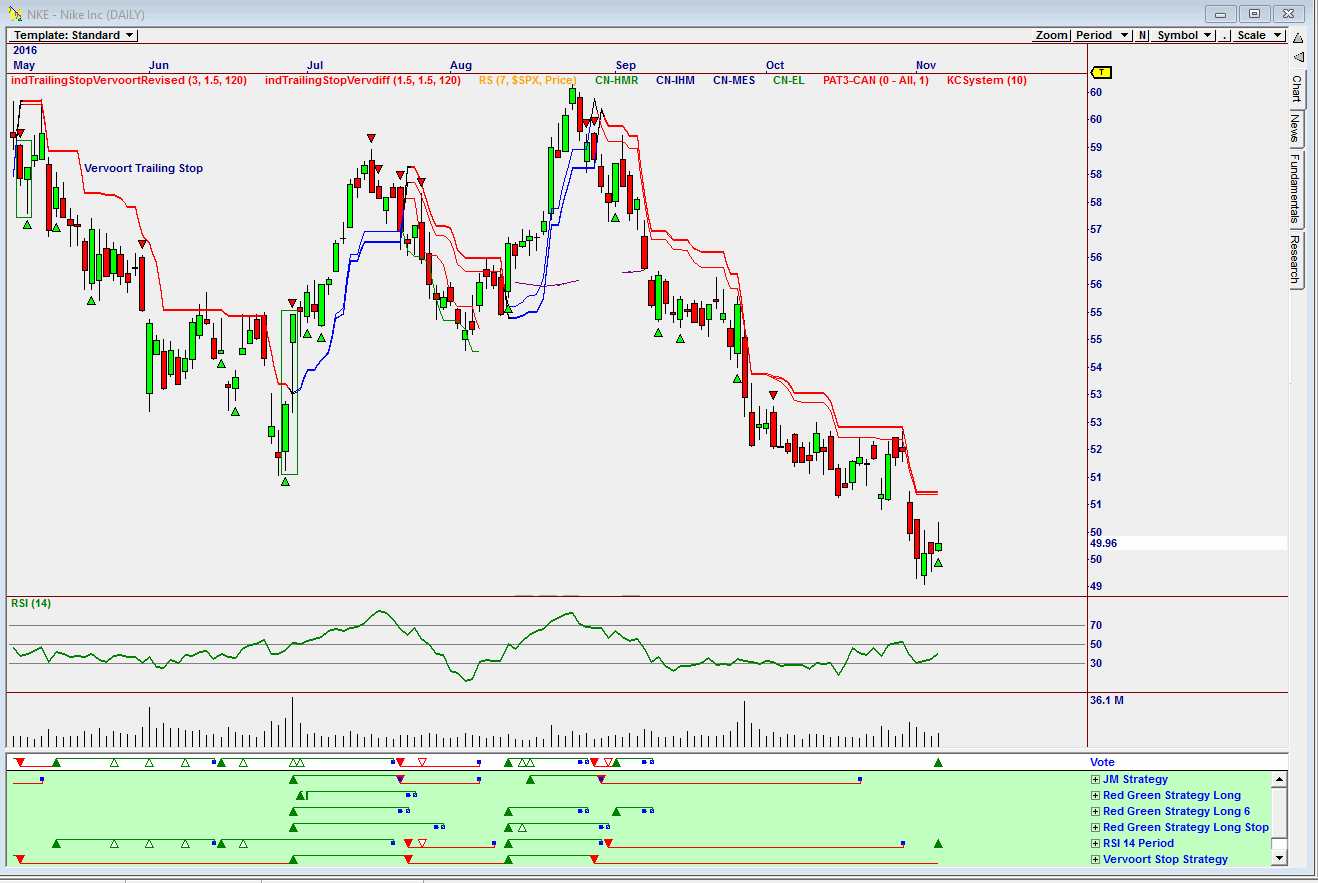
| The chart in Figure 3 is a daily chart with an Elliott wave count suggesting that a WAVE C has been completed and that the share price should start moving up. Both indicators shown on the chart have given buy signals. Investors who are more cautious could wait for the price to move above the upper JM Internal Band. The JM Internal Band is a 15-period simple moving average offset by 2% positive and 2% negative. A move above the upper band suggests a buy and below the lower band a sell as shown on the chart. |

|
| Figure 4. Daily Omnitrader Chart. |
| Graphic provided by: Omnitrader. |
| |
| The chart in Figure 4 is an Omnitrader chart that brought a buy of the share to my attention. Note the buy signal on the Vote line triggered by the RSI 14 period strategy shown in green below the Vote line. Nike has been placed on my watch list as a possible buy. One could wait to see how things shake out following the Presidential election before buying, however, this a share that could move up strongly in the near term. |
Has been a technical analyst since 1969, and has worked as a futures and options trader with First Financial Futures in Johannesburg, South Africa.
| Address: | 3256 West 24th Ave |
| Vancouver, BC | |
| Phone # for sales: | 6042634214 |
| E-mail address: | petroosp@gmail.com |
Click here for more information about our publications!
PRINT THIS ARTICLE

Request Information From Our Sponsors
- StockCharts.com, Inc.
- Candle Patterns
- Candlestick Charting Explained
- Intermarket Technical Analysis
- John Murphy on Chart Analysis
- John Murphy's Chart Pattern Recognition
- John Murphy's Market Message
- MurphyExplainsMarketAnalysis-Intermarket Analysis
- MurphyExplainsMarketAnalysis-Visual Analysis
- StockCharts.com
- Technical Analysis of the Financial Markets
- The Visual Investor
- VectorVest, Inc.
- Executive Premier Workshop
- One-Day Options Course
- OptionsPro
- Retirement Income Workshop
- Sure-Fire Trading Systems (VectorVest, Inc.)
- Trading as a Business Workshop
- VectorVest 7 EOD
- VectorVest 7 RealTime/IntraDay
- VectorVest AutoTester
- VectorVest Educational Services
- VectorVest OnLine
- VectorVest Options Analyzer
- VectorVest ProGraphics v6.0
- VectorVest ProTrader 7
- VectorVest RealTime Derby Tool
- VectorVest Simulator
- VectorVest Variator
- VectorVest Watchdog
