HOT TOPICS LIST
- MACD
- Fibonacci
- RSI
- Gann
- ADXR
- Stochastics
- Volume
- Triangles
- Futures
- Cycles
- Volatility
- ZIGZAG
- MESA
- Retracement
- Aroon
INDICATORS LIST
LIST OF TOPICS
PRINT THIS ARTICLE
by Koos van der Merwe
With only 4 days left before the US Presidential election, and uncertainty as the outcome, finding a share to invest in is not that easy.
Position: Buy
Koos van der Merwe
Has been a technical analyst since 1969, and has worked as a futures and options trader with First Financial Futures in Johannesburg, South Africa.
PRINT THIS ARTICLE
TECHNICAL ANALYSIS
Looking For A Winner
11/04/16 12:10:54 PMby Koos van der Merwe
With only 4 days left before the US Presidential election, and uncertainty as the outcome, finding a share to invest in is not that easy.
Position: Buy
| On Friday, October 29th, when the FBI sent a letter to Congress stating that they were investigating more emails they recently discovered that were sent by Hillary Clinton, the intraday market fell strongly. This is an indication of the uncertainty in the stock market prior to the election. Investors appear to be standing on the sidelines and waiting to see who the next President will be before risking their money. However, finding a share that moves contrary to the general move of the indices could be a good investment. |

|
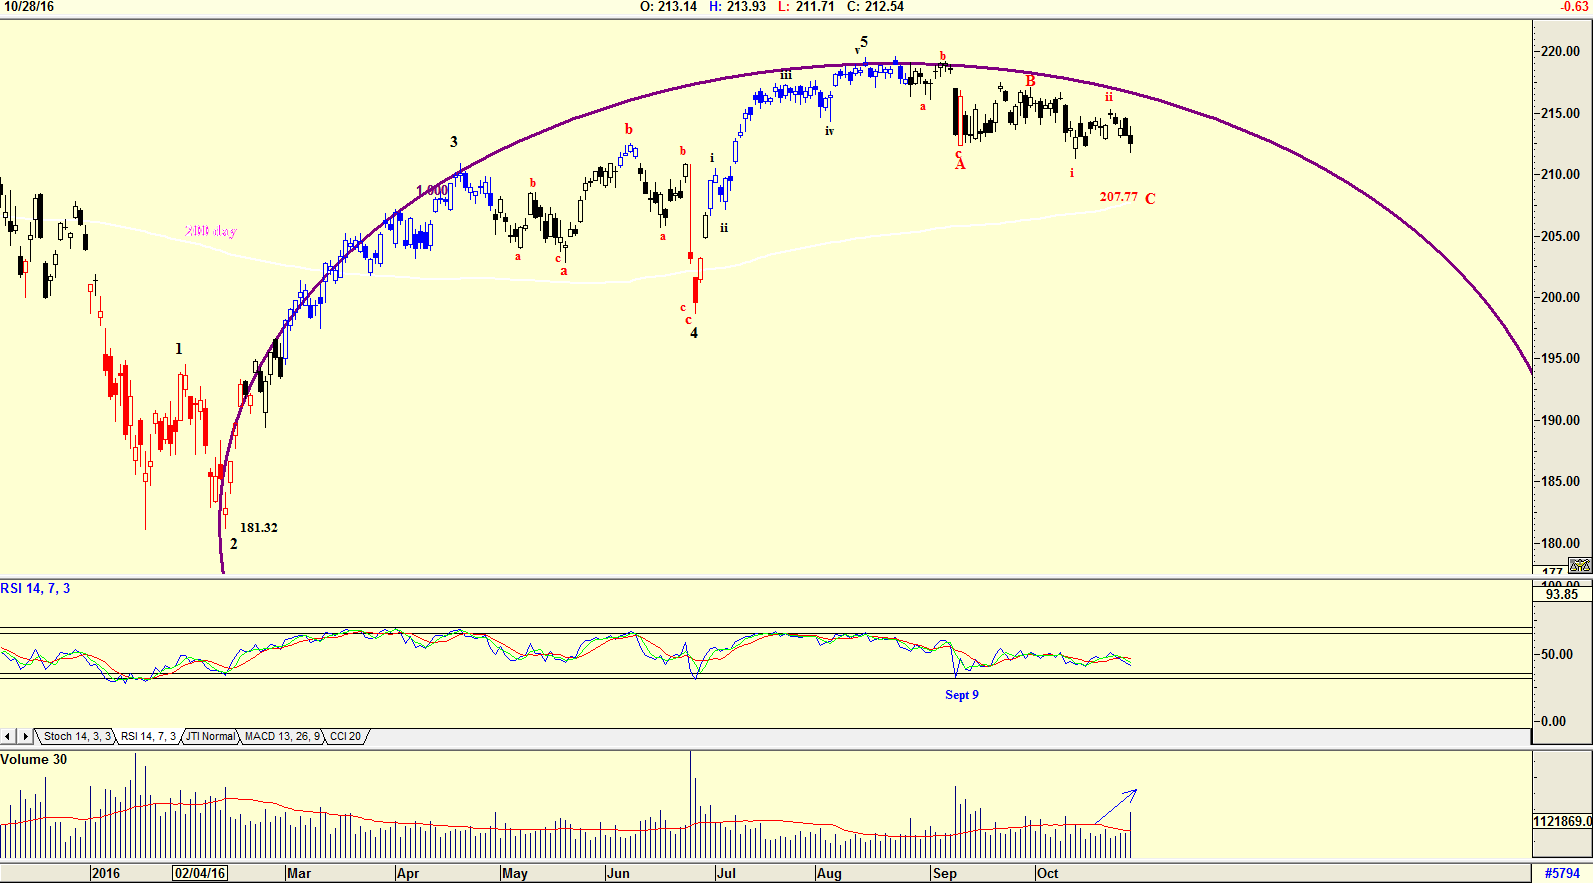
| Figure 1. SPY daily chart. |
| Graphic provided by: AdvancedGET. |
| |
| The chart in Figure 1 is a chart of the ETF Spiders (SPY) showing a 200-day moving average, an inverted saucer formation and an Elliott wave count that suggests the ETF could fall to the 200-day moving average in the region of $207. With the fall in the ETF on Friday, October 28, volume was high, suggesting further weakness ahead. The RSI indicator, which gave a BUY signal on September 9th, is moving sideways, confirming the uncertainty. |

|
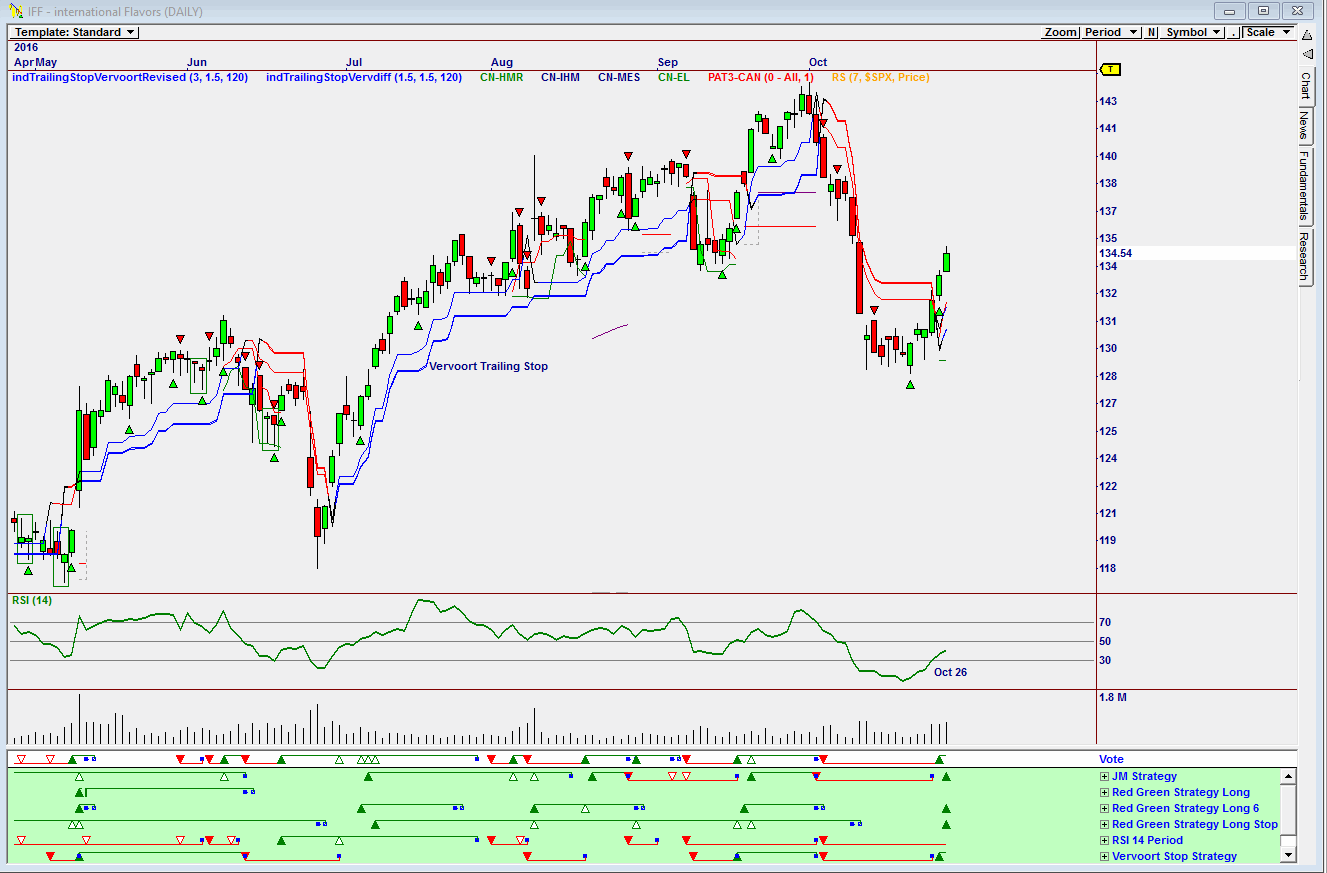
| Figure 2. Daily Omnitrader chart of International Flavors. |
| Graphic provided by: Omnitrader. |
| |
| So, looking for a share to buy, the program Omnitrader, analyzed 2607 shares and came up with 15 shares to look at, based on their Advisor Rating and Back Test Hit rate both above 50%. Looking at each chart, the share, International Flavors offered the best investment chart pattern. The Vote line shown on the chart has suggested a buy based on 4 strategies shown in green below the vote line. The RSI indicator suggested a buy on October 26th. |

|
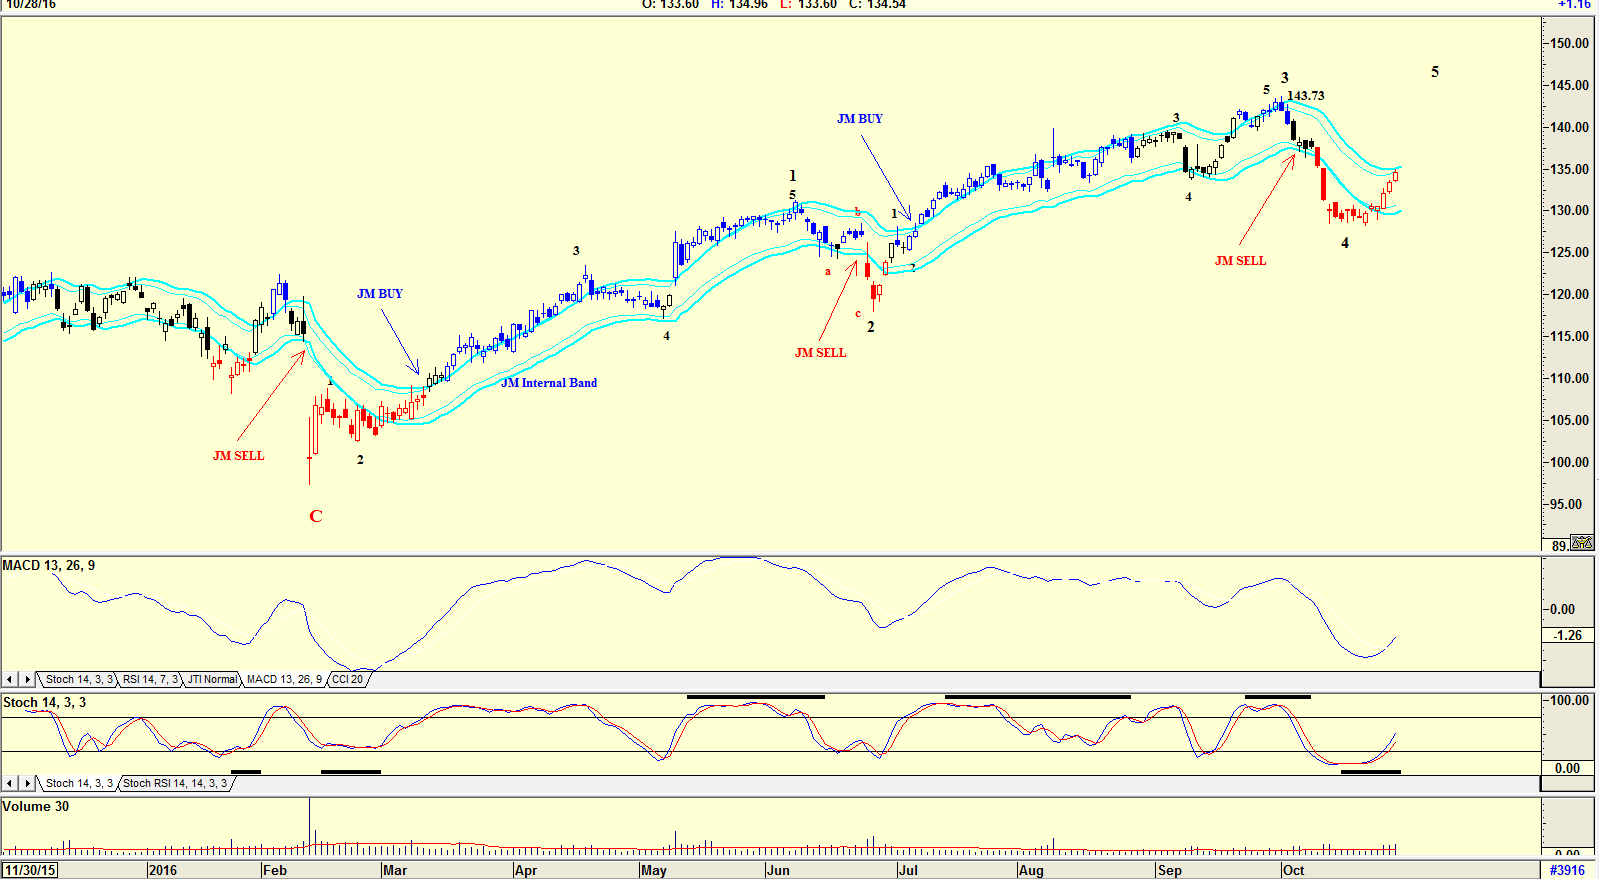
| Figure 3. Daily chart with JM Internal Band and Elliott wave count. |
| Graphic provided by: AdvancedGET. |
| |
| The chart in Figure 3 is a daily chart of International Flavors with an Elliott wave count suggesting the share is rising in a Wave 5 with a target above $143.73. The indicators, MACD and Stochastic, are both suggesting a buy. The share price has not given a buy by moving above the upper band of the JM Internal Band but looks close to doing so. The JM Internal Band is a 15-period simple moving average offset by 2% positive and 2% negative. A move above the upper band suggests a buy and below the lower band a sell, as shown on the chart. Buying the share, International Flavors, could be an advantage. On Wednesday 26th October, Zacks Investment Research upgraded the share from a "hold" rating to a "buy" rating with a target of $146. |
Has been a technical analyst since 1969, and has worked as a futures and options trader with First Financial Futures in Johannesburg, South Africa.
| Address: | 3256 West 24th Ave |
| Vancouver, BC | |
| Phone # for sales: | 6042634214 |
| E-mail address: | petroosp@gmail.com |
Click here for more information about our publications!
PRINT THIS ARTICLE

Request Information From Our Sponsors
- StockCharts.com, Inc.
- Candle Patterns
- Candlestick Charting Explained
- Intermarket Technical Analysis
- John Murphy on Chart Analysis
- John Murphy's Chart Pattern Recognition
- John Murphy's Market Message
- MurphyExplainsMarketAnalysis-Intermarket Analysis
- MurphyExplainsMarketAnalysis-Visual Analysis
- StockCharts.com
- Technical Analysis of the Financial Markets
- The Visual Investor
- VectorVest, Inc.
- Executive Premier Workshop
- One-Day Options Course
- OptionsPro
- Retirement Income Workshop
- Sure-Fire Trading Systems (VectorVest, Inc.)
- Trading as a Business Workshop
- VectorVest 7 EOD
- VectorVest 7 RealTime/IntraDay
- VectorVest AutoTester
- VectorVest Educational Services
- VectorVest OnLine
- VectorVest Options Analyzer
- VectorVest ProGraphics v6.0
- VectorVest ProTrader 7
- VectorVest RealTime Derby Tool
- VectorVest Simulator
- VectorVest Variator
- VectorVest Watchdog
