HOT TOPICS LIST
- MACD
- Fibonacci
- RSI
- Gann
- ADXR
- Stochastics
- Volume
- Triangles
- Futures
- Cycles
- Volatility
- ZIGZAG
- MESA
- Retracement
- Aroon
INDICATORS LIST
LIST OF TOPICS
PRINT THIS ARTICLE
by Koos van der Merwe
Gold crashed through $1,300 an ounce earlier this month. Is it time to start buying gold?
Position: Accumulate
Koos van der Merwe
Has been a technical analyst since 1969, and has worked as a futures and options trader with First Financial Futures in Johannesburg, South Africa.
PRINT THIS ARTICLE
TECHNICAL ANALYSIS
Is It Time To Buy Gold?
10/18/16 04:34:54 PMby Koos van der Merwe
Gold crashed through $1,300 an ounce earlier this month. Is it time to start buying gold?
Position: Accumulate
| On Tuesday, October 4th, the price of gold crashed through $1,300 an ounce, a level last seen before the Brexit vote gave it a boost. On Friday, October 7th, the Department of Labor announced that only 156,000 jobs were created in September compared to the 175,000 jobs forecasted by the economists. The unemployment rate rose slightly to 5% with average hourly earnings once again improving, standing 2.6% higher this year. The gold markets rose after this announcement, also responding to the soft US jobs report and a weaker US dollar. What now for the future? Is it time to start loading up on gold? One should not forget that the gold price is affected by world political events, not just US internal events. The present events influencing the gold price are Brexit, social and political discord in Western Europe, confusion on monetary policy prescriptions, and the ongoing crises enveloping Deutsche Bank. |

|
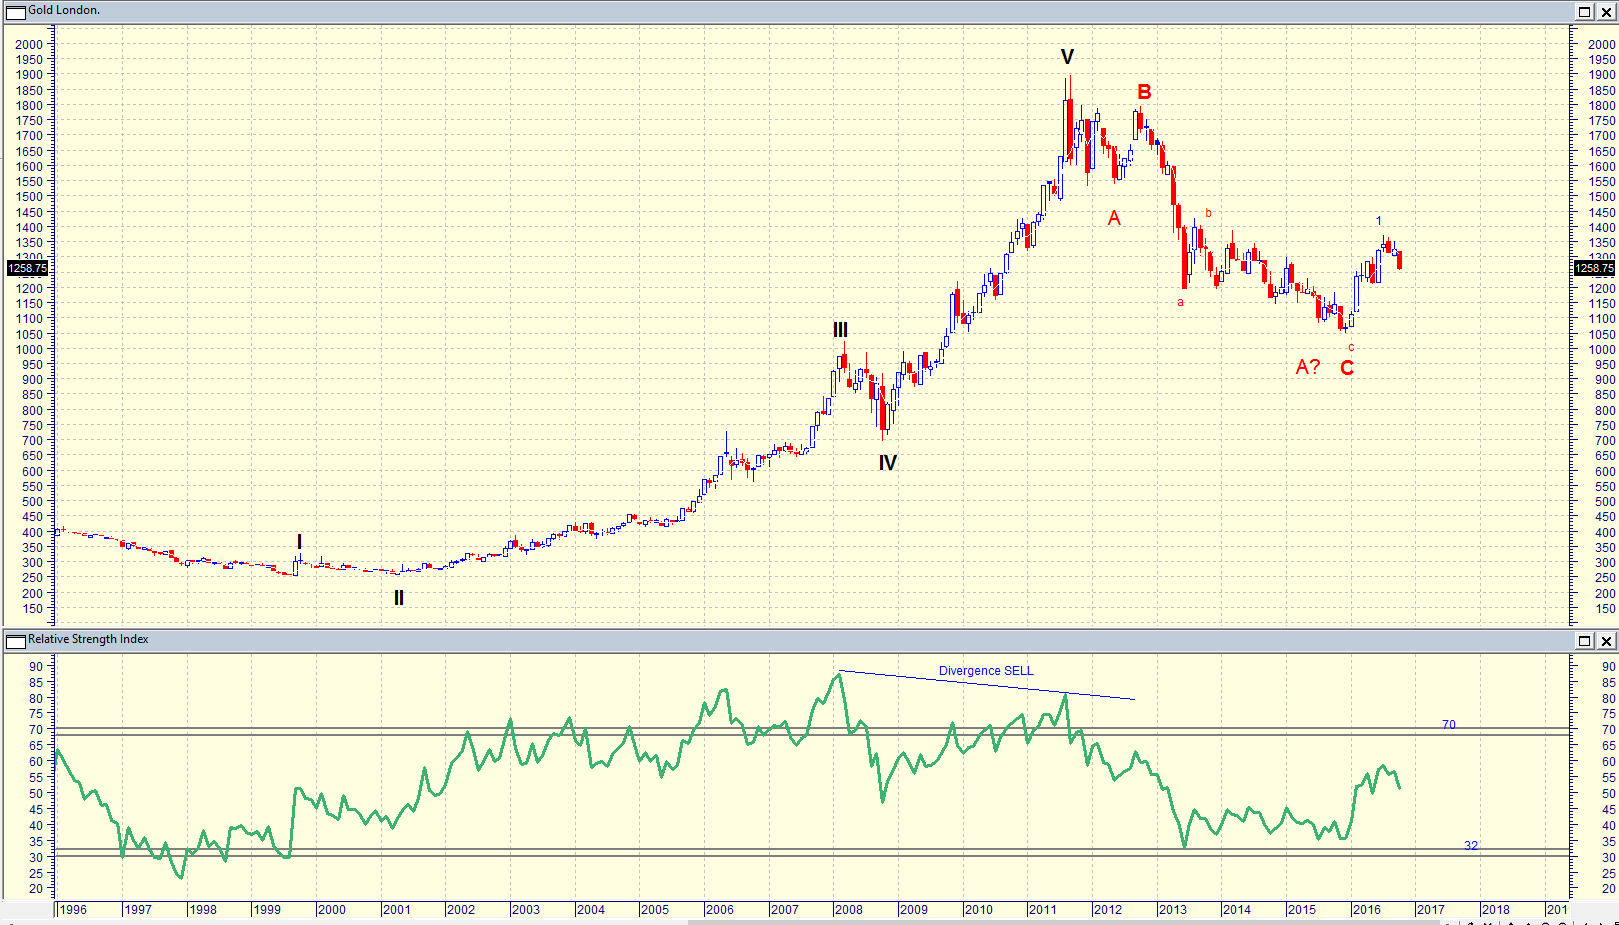
| Figure 1. London Gold price. |
| Graphic provided by: MetaStock. |
| |
| The chart in Figure 1 is a daily chart of the gold price from 1996 to October 7th, 2016. The chart is suggesting that an ABC Elliott wave correction has been completed, and that the gold price could start rising in a new Elliott wave bullish count, with WAVE 1 completed. The RSI indicator however did not fall below the 32 horizontal, suggesting that the WAVE C shown on the chart could be a WAVE A, with a WAVE B up still to follow. |

|
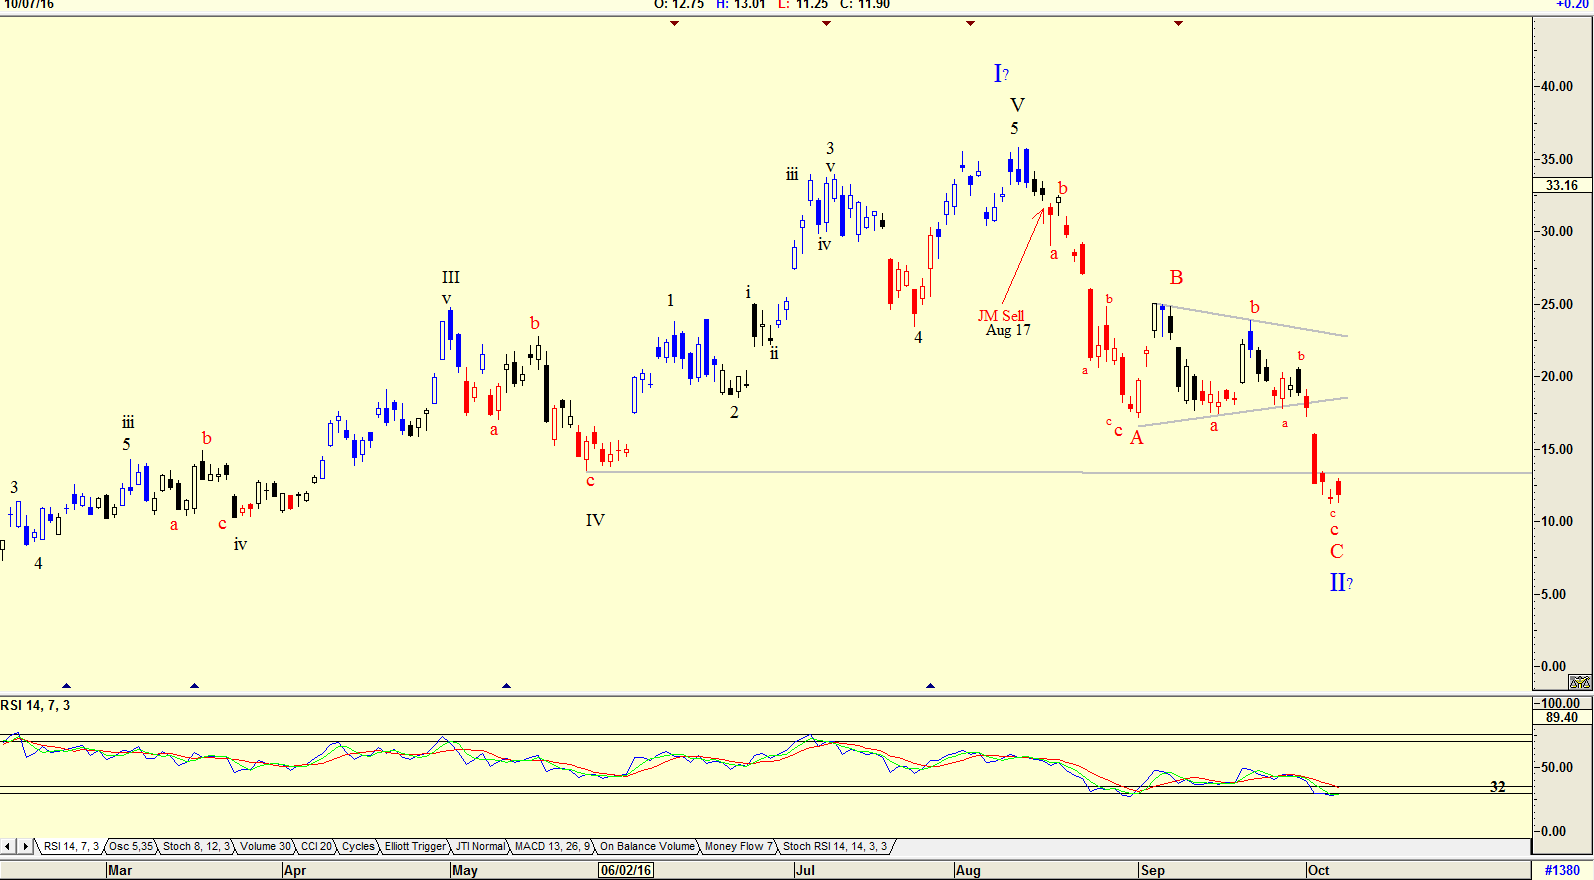
| Figure 2. Direxion Gold Miners ETF. |
| Graphic provided by: AdvancedGET. |
| |
| Figure 2 is a chart of the ETF Direxion Gold Miners (NUGT). This is an ETF that is a 3x leveraged exchange traded fund (ETF) that should be used for short term trades only, however it does give one an idea of where Gold is going. The chart in Figure 2 does suggest that an Elliott wave C is complete, and that the price should start rising in a WAVE I. One concern however, is the fact that the current price is below that of WAVE IV, as shown on the chart. Usually, a WAVE V correction should not fall below the low of the WAVE IV. The fact that this has happened suggests that a MAJOR WAVE I and MAJOR WAVE II of a strong bull trend has formed. If this is the case, then Gold is going to rise astronomically in the years ahead. Do note the RSI indicator, which is presently at oversold levels. It does look as if the Gold price is bottoming. Whether one should start buying Gold mining shares for the long term, depends on your analysis of the mining company you prefer. However short term Traders should have a good look at the Direxion Gold Miners ETF. Yes, there is DUST, the Direxion Gold Miners bear ETF and many other ETFs related to the Gold price that can be researched. Look at them all, and make your own decision. |
Has been a technical analyst since 1969, and has worked as a futures and options trader with First Financial Futures in Johannesburg, South Africa.
| Address: | 3256 West 24th Ave |
| Vancouver, BC | |
| Phone # for sales: | 6042634214 |
| E-mail address: | petroosp@gmail.com |
Click here for more information about our publications!
PRINT THIS ARTICLE

|

Request Information From Our Sponsors
- StockCharts.com, Inc.
- Candle Patterns
- Candlestick Charting Explained
- Intermarket Technical Analysis
- John Murphy on Chart Analysis
- John Murphy's Chart Pattern Recognition
- John Murphy's Market Message
- MurphyExplainsMarketAnalysis-Intermarket Analysis
- MurphyExplainsMarketAnalysis-Visual Analysis
- StockCharts.com
- Technical Analysis of the Financial Markets
- The Visual Investor
- VectorVest, Inc.
- Executive Premier Workshop
- One-Day Options Course
- OptionsPro
- Retirement Income Workshop
- Sure-Fire Trading Systems (VectorVest, Inc.)
- Trading as a Business Workshop
- VectorVest 7 EOD
- VectorVest 7 RealTime/IntraDay
- VectorVest AutoTester
- VectorVest Educational Services
- VectorVest OnLine
- VectorVest Options Analyzer
- VectorVest ProGraphics v6.0
- VectorVest ProTrader 7
- VectorVest RealTime Derby Tool
- VectorVest Simulator
- VectorVest Variator
- VectorVest Watchdog
