HOT TOPICS LIST
- MACD
- Fibonacci
- RSI
- Gann
- ADXR
- Stochastics
- Volume
- Triangles
- Futures
- Cycles
- Volatility
- ZIGZAG
- MESA
- Retracement
- Aroon
INDICATORS LIST
LIST OF TOPICS
PRINT THIS ARTICLE
by Koos van der Merwe
In today's uncertain market, investors look for stocks offering solid dividends to buy and hold. Traders, on the other hand, look for stocks to buy and sell for a profit.
Position: Accumulate
Koos van der Merwe
Has been a technical analyst since 1969, and has worked as a futures and options trader with First Financial Futures in Johannesburg, South Africa.
PRINT THIS ARTICLE
TECHNICAL INDICATORS
Looking For The Stock To Trade
10/05/16 04:09:30 PMby Koos van der Merwe
In today's uncertain market, investors look for stocks offering solid dividends to buy and hold. Traders, on the other hand, look for stocks to buy and sell for a profit.
Position: Accumulate
| Looking for a strategy that chooses a stock to trade — a strategy that is a winning one — is not that easy. However, after many years of trading the market, I have come to rely on two strategies that have served me well. The first is one everyone knows, Wells Wilders' RSI 14-period strategy. The second is a strategy a woman introduced me to in the 1980's. When she gave it to me she said, "it has served me well over the years." I have never forgotten those words, and today still have the JM Internal band as my primary buy/sell strategy. The JM Internal Band is a 15-period simple moving average offset by 2% positive and 2% negative. A move above the upper band suggests a buy and below the lower band a sell. The charts below are Omnitrader charts with the Vote line showing the buy/sell signals suggested by both indicators. There are four charts below, and looking at them will help you decide on the strength of each strategy. The charts also show the Vervoort stop-loss, which I also find very helpful. |

|
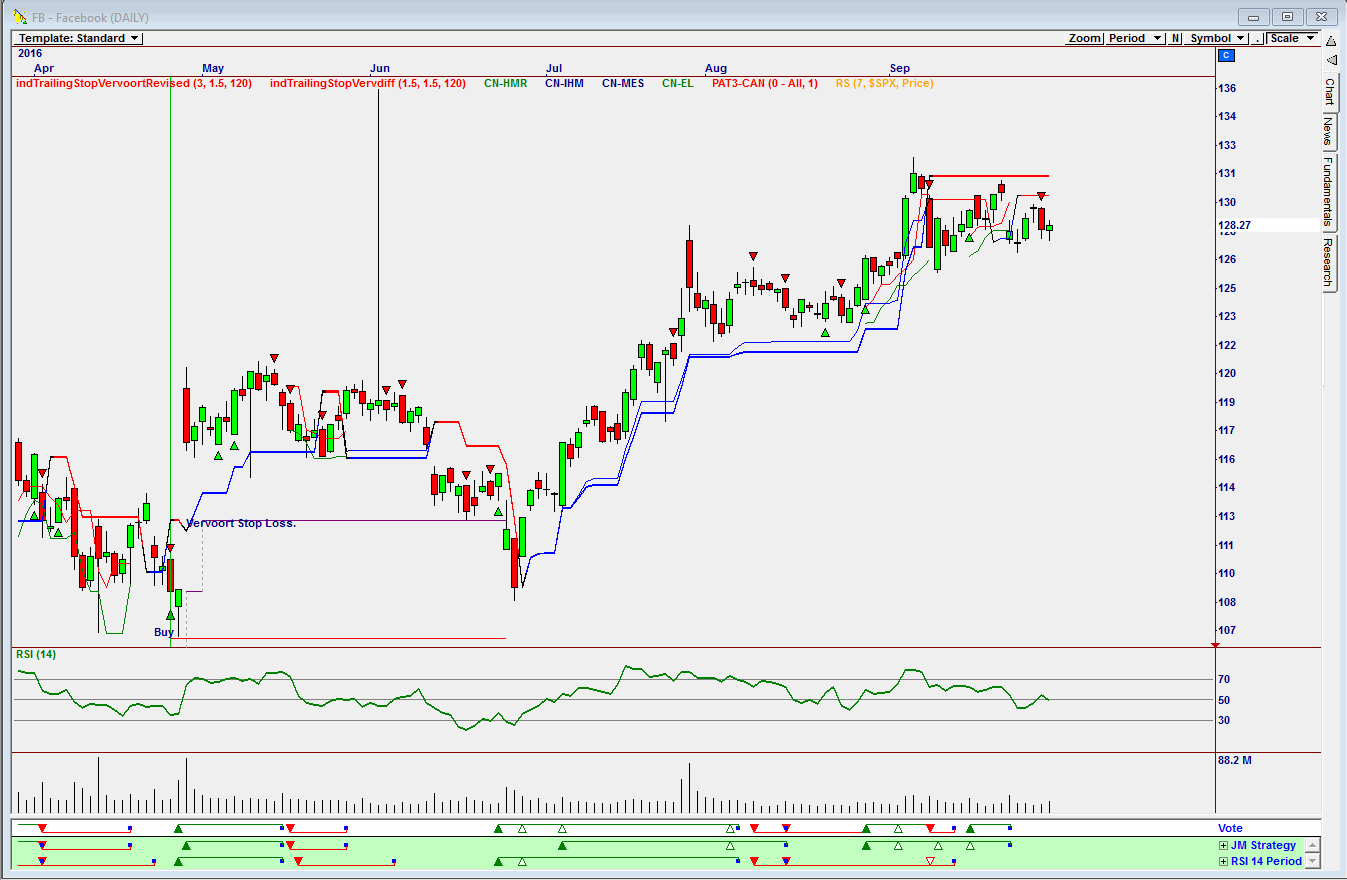
| Figure 1. Facebook showing By and Sell in Vote line. |
| Graphic provided by: Omnitrader. |
| |
| The chart in Figure 1 is a chart of Facebook. Note how the Vote line suggested buys and sells based on the JM Strategy and RSI 14 Strategy. Note how in the majority of trades, following the signals suggested by the VOTE line would have been highly profitable. One could also use the Vervoort stop-loss to take one out of a trade before the Vote line suggests a sell. |

|
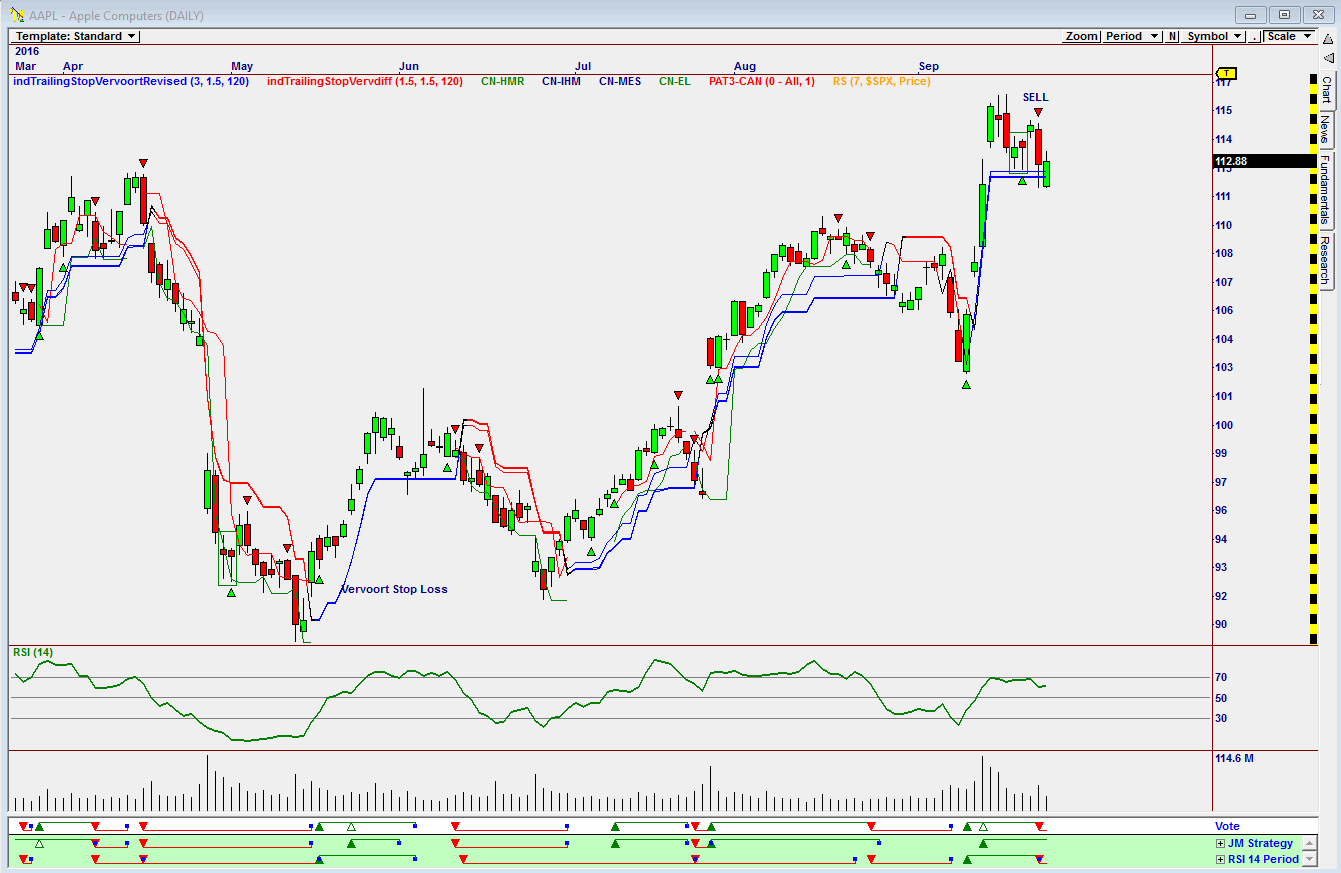
| Figure 2 Chart of Apple showing Buy and Sell signals |
| Graphic provided by: Omnitrader. |
| |
| The chart in Figure 2 is a chart of Apple The Vote line is presently suggesting a sell based on the RSI 14 strategy. Simply looking at the chart, one can see how highly profitable the strategy is. |

|
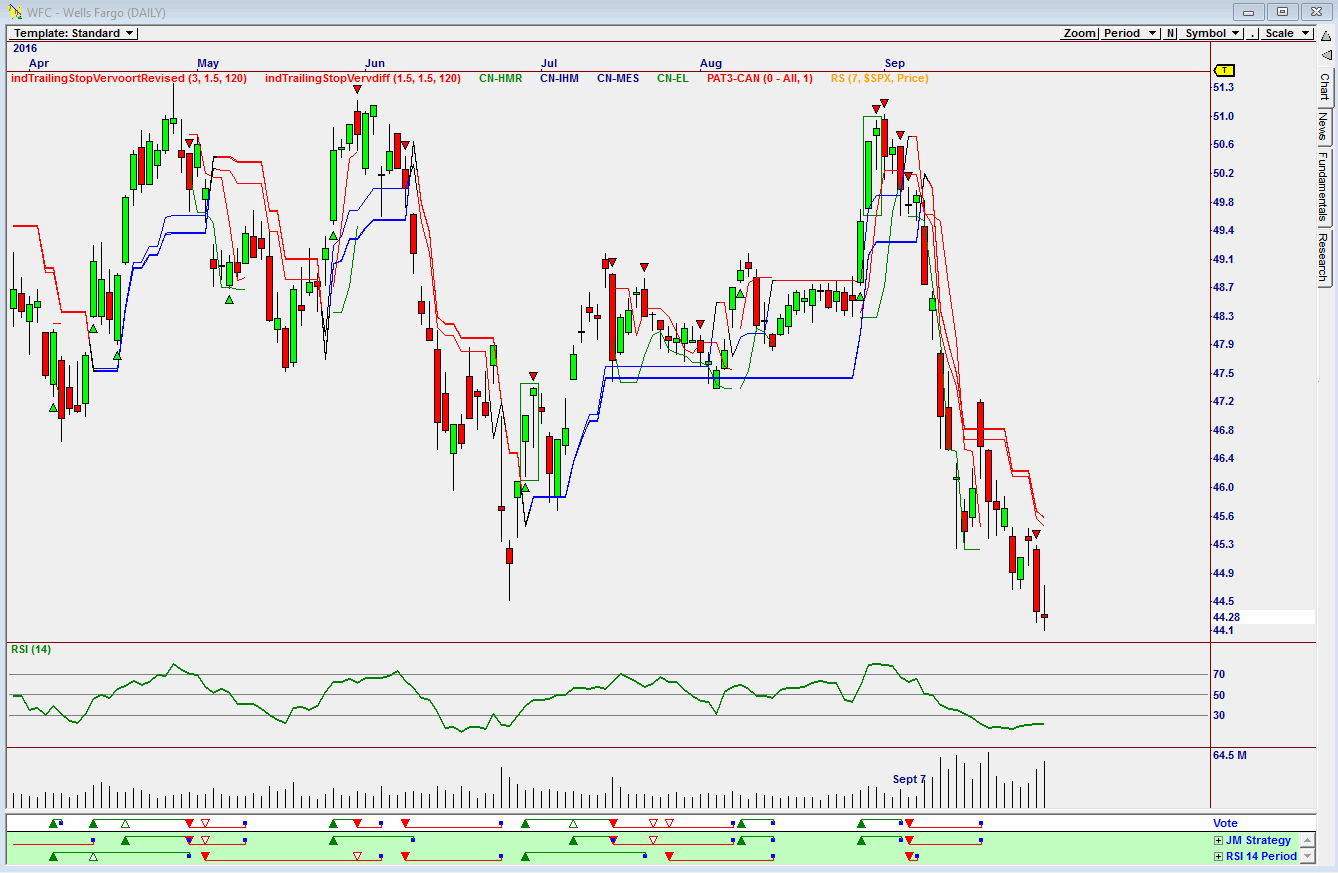
| Figure 3. Chart of Wells Fargo with sell signal. |
| Graphic provided by: Omntrader. |
| |
| The chart in Figure 3 is a chart of Wells Fargo. Note how the Vote line suggested a Sell on September 7th based on both the RSI 14 and JM Internal Band strategies, long before Wells Fargo hit the headlines with its scandal. |

|
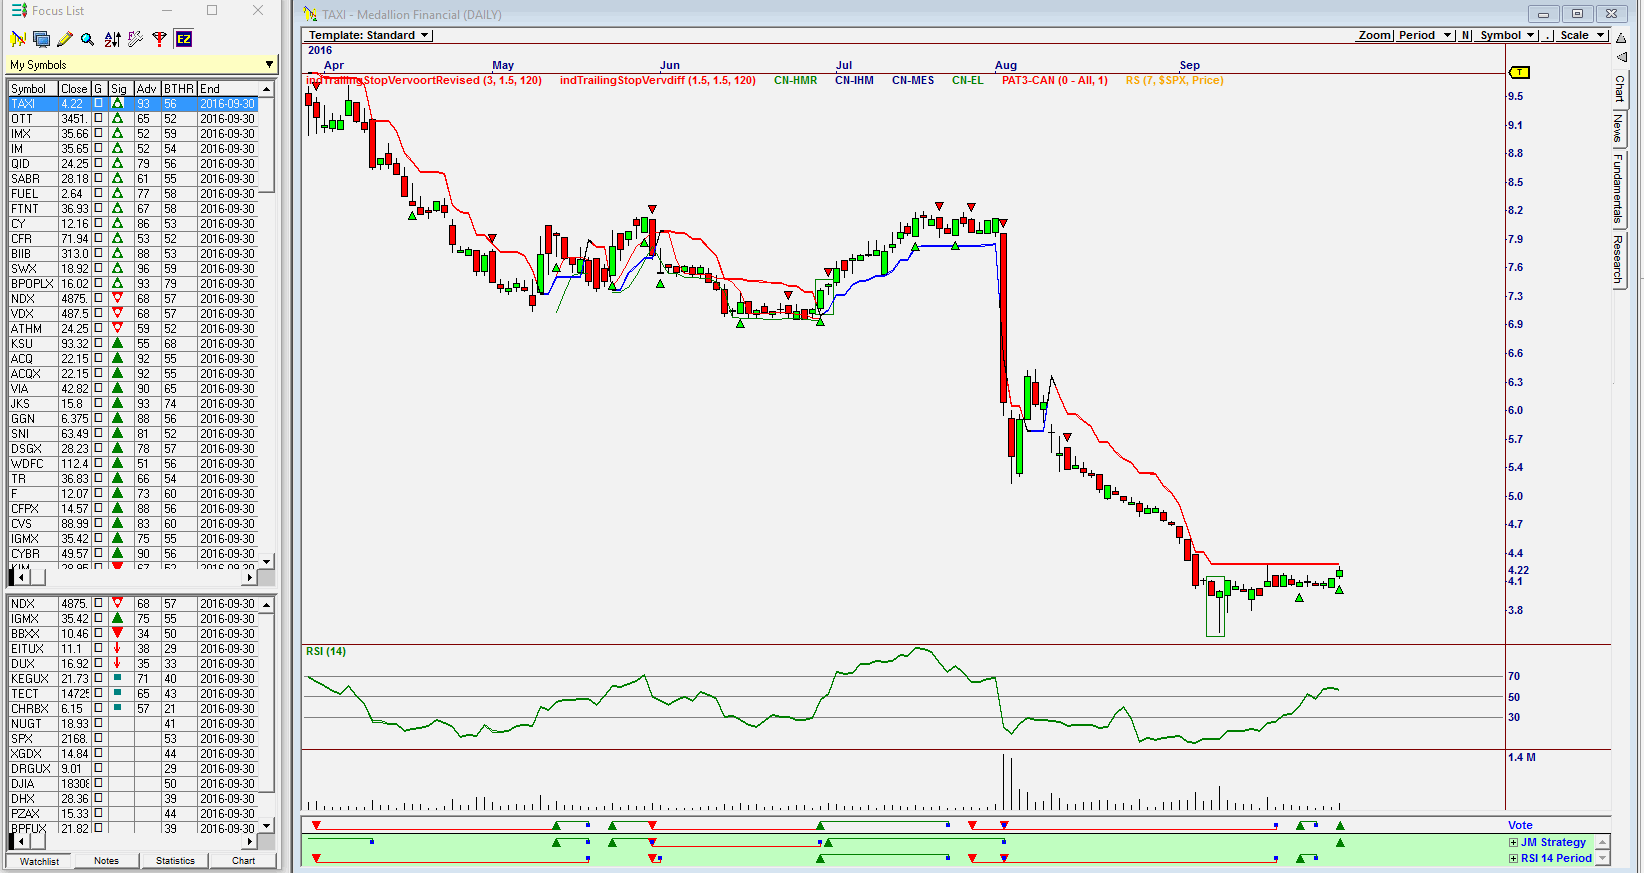
| Figure 4. Chart showing analysis of shares. |
| Graphic provided by: Omnitrader. |
| |
| The program Omnitrader offers the ability to analyze stocks and highlight those suggesting a new buy and sell. This can be seen in the chart in Figure 4. The first symbol shown is TAXI (Medallion Financial). The chart shows the buy and sell signals given. It is presently suggesting a buy on all the symbols shown. Using this strategy has proven to be very profitable over the years, especially when the stock suggested is one that is well known and loved by all. Applying this strategy to all and any and every analytical program is no problem, one of the reasons why it can be used by many traders. |
Has been a technical analyst since 1969, and has worked as a futures and options trader with First Financial Futures in Johannesburg, South Africa.
| Address: | 3256 West 24th Ave |
| Vancouver, BC | |
| Phone # for sales: | 6042634214 |
| E-mail address: | petroosp@gmail.com |
Click here for more information about our publications!
PRINT THIS ARTICLE

Request Information From Our Sponsors
- VectorVest, Inc.
- Executive Premier Workshop
- One-Day Options Course
- OptionsPro
- Retirement Income Workshop
- Sure-Fire Trading Systems (VectorVest, Inc.)
- Trading as a Business Workshop
- VectorVest 7 EOD
- VectorVest 7 RealTime/IntraDay
- VectorVest AutoTester
- VectorVest Educational Services
- VectorVest OnLine
- VectorVest Options Analyzer
- VectorVest ProGraphics v6.0
- VectorVest ProTrader 7
- VectorVest RealTime Derby Tool
- VectorVest Simulator
- VectorVest Variator
- VectorVest Watchdog
- StockCharts.com, Inc.
- Candle Patterns
- Candlestick Charting Explained
- Intermarket Technical Analysis
- John Murphy on Chart Analysis
- John Murphy's Chart Pattern Recognition
- John Murphy's Market Message
- MurphyExplainsMarketAnalysis-Intermarket Analysis
- MurphyExplainsMarketAnalysis-Visual Analysis
- StockCharts.com
- Technical Analysis of the Financial Markets
- The Visual Investor
