HOT TOPICS LIST
- MACD
- Fibonacci
- RSI
- Gann
- ADXR
- Stochastics
- Volume
- Triangles
- Futures
- Cycles
- Volatility
- ZIGZAG
- MESA
- Retracement
- Aroon
INDICATORS LIST
LIST OF TOPICS
PRINT THIS ARTICLE
by Koos van der Merwe
With uncertainty in the market looking for a solid investment becomes a must.
Position: Accumulate
Koos van der Merwe
Has been a technical analyst since 1969, and has worked as a futures and options trader with First Financial Futures in Johannesburg, South Africa.
PRINT THIS ARTICLE
ELLIOTT WAVE
Starwood Property Trust
09/21/16 04:22:07 PMby Koos van der Merwe
With uncertainty in the market looking for a solid investment becomes a must.
Position: Accumulate
| The US Presidential election is capturing the attention of everyone. How will the stock market behave should either candidate win is on everyone's mind? Then of course there is Janet Yellen, Chair of the Federal Reserve. Will she announce an interest rate increase in September, December or only in 2017? September is well known as the quietest month of the year, as investment advisors return to their workbench after the summer holidays. But with all this uncertainty hanging over their heads, isn't the answer to simply sit on the sidelines and wait to see what happens? Then of course there are computers, which do not suffer from emotions, and continually analyze the market looking for the best investments. Personally, when things are tough, I look for interest income. Starwood Property Trust Inc. caught my attention because its Dividend & Yield is 8.55%, as of September 16th. |

|
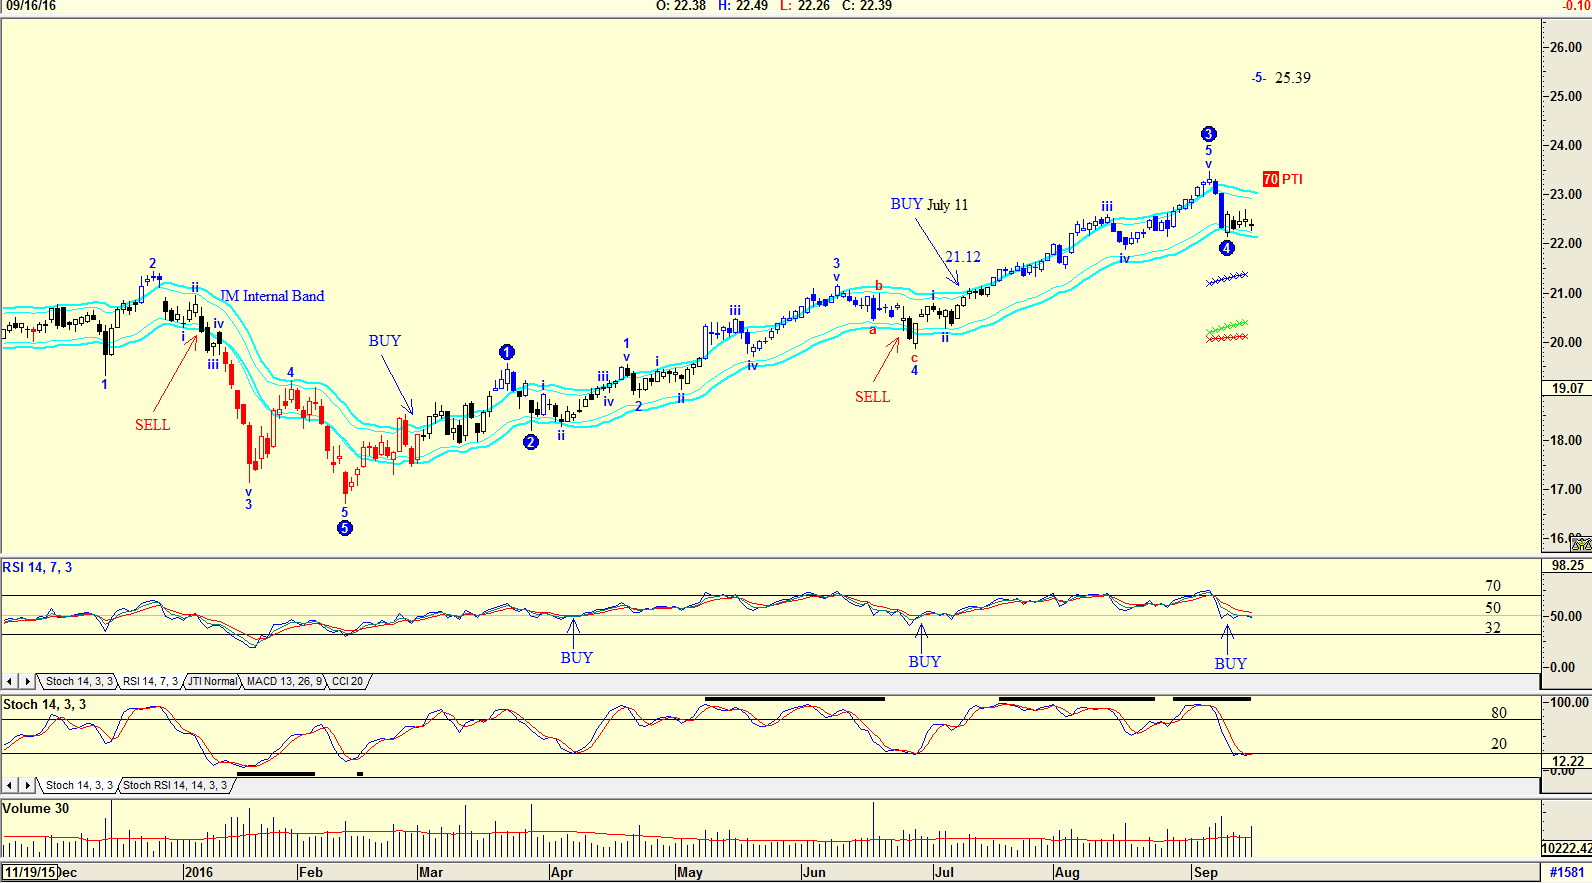
| Figure 1. Daily chart with JM Internal Band. |
| Graphic provided by: AdvancedGET. |
| |
| The chart in Figure 1 is a daily chart with and Elliott wave count suggesting that there is a 70% (PTI) chance of the share price rising in a Wave 5 to $25.39. PTI is the Probability Index suggesting what the probability is of a rise to $25.39. Do note the two indicators, the RSI 14 and the Stochastic 14. The RSI indicator is suggesting a buy even though it has not fallen below the 32 horizontal, simply because previous buys were given when the share price fell below and then rose above the 50 horizontal. The Stochastic 14 indicator is suggesting a buy as it flirts with the 20 horizontal. The JM Internal Band gave a buy on July 11th when the share price was $21.12. The JM Internal Band is a 15 period simple moving average offset by 2% plus and 2% negative. A move above the upper band suggests a buy and below the lower band a sell. The share price is presently testing the lower band, but has not triggered a sell signal. |

|
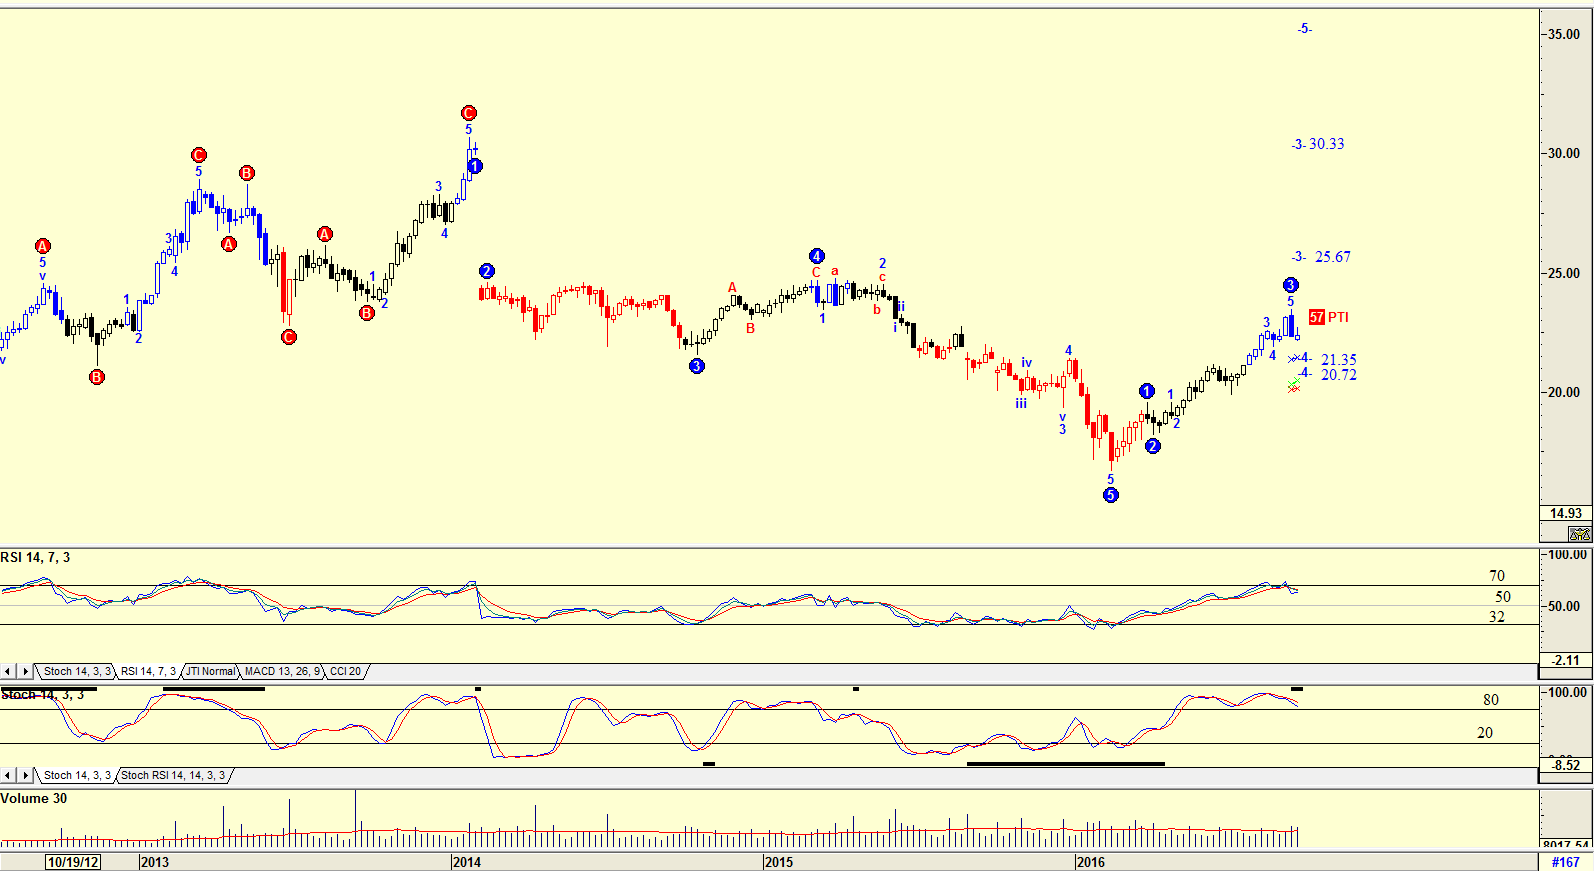
| Figure 2. Weekly Chart with Elliott wave count. |
| Graphic provided by: AdvancedGET. |
| |
| The weekly chart in Figure 2 has an Elliott wave count suggesting that the price should fall in a Wave 4 to either $21.35 or $20.72. The PTI is 57, suggesting that there is a 57% chance of this occurring. However, the Elliott wave count is also suggesting that the Wave 3 could still rise to either $25.67 or $30.33. However, with both the RSI 14 period indicator and the Stochastic indicator suggesting a sell, the share looks more likely to fall in a Wave 4. With the Presidential election capturing everyone's attention; with Janet Yellen of the Federal Reserve speaking in the week of September 19th to 23rd; and finally, with October, the month known for market crashes, just around the corner, I would be tempted to wait for a buy signal to be suggested by the weekly chart. However, this is a share I shall watch the charts every day waiting for a buy signal. |
Has been a technical analyst since 1969, and has worked as a futures and options trader with First Financial Futures in Johannesburg, South Africa.
| Address: | 3256 West 24th Ave |
| Vancouver, BC | |
| Phone # for sales: | 6042634214 |
| E-mail address: | petroosp@gmail.com |
Click here for more information about our publications!
PRINT THIS ARTICLE

|

Request Information From Our Sponsors
- StockCharts.com, Inc.
- Candle Patterns
- Candlestick Charting Explained
- Intermarket Technical Analysis
- John Murphy on Chart Analysis
- John Murphy's Chart Pattern Recognition
- John Murphy's Market Message
- MurphyExplainsMarketAnalysis-Intermarket Analysis
- MurphyExplainsMarketAnalysis-Visual Analysis
- StockCharts.com
- Technical Analysis of the Financial Markets
- The Visual Investor
- VectorVest, Inc.
- Executive Premier Workshop
- One-Day Options Course
- OptionsPro
- Retirement Income Workshop
- Sure-Fire Trading Systems (VectorVest, Inc.)
- Trading as a Business Workshop
- VectorVest 7 EOD
- VectorVest 7 RealTime/IntraDay
- VectorVest AutoTester
- VectorVest Educational Services
- VectorVest OnLine
- VectorVest Options Analyzer
- VectorVest ProGraphics v6.0
- VectorVest ProTrader 7
- VectorVest RealTime Derby Tool
- VectorVest Simulator
- VectorVest Variator
- VectorVest Watchdog
