HOT TOPICS LIST
- MACD
- Fibonacci
- RSI
- Gann
- ADXR
- Stochastics
- Volume
- Triangles
- Futures
- Cycles
- Volatility
- ZIGZAG
- MESA
- Retracement
- Aroon
INDICATORS LIST
LIST OF TOPICS
PRINT THIS ARTICLE
by Koos van der Merwe
So, with the stock market suggesting negativity, is Facebook a buy?
Position: Accumulate
Koos van der Merwe
Has been a technical analyst since 1969, and has worked as a futures and options trader with First Financial Futures in Johannesburg, South Africa.
PRINT THIS ARTICLE
TECHNICAL ANALYSIS
Another Look At Facebook
09/14/16 05:14:12 PMby Koos van der Merwe
So, with the stock market suggesting negativity, is Facebook a buy?
Position: Accumulate
| With the indexes starting to weaken as investors and traders return to the stock market after Labor Day, is Facebook a buy? September is well known to be the quietest month of the year, usually leading into an October well known for its market crashes. Is it worth taking the risk and buying Facebook shares now, or should one wait till November — a November that will highlight who the next US President will be? Facebook shares, after a shaky listing on the market, have gone up, up and away. |

|
| Figure 1. Weekly Chart. |
| Graphic provided by: AdvancedGET. |
| |
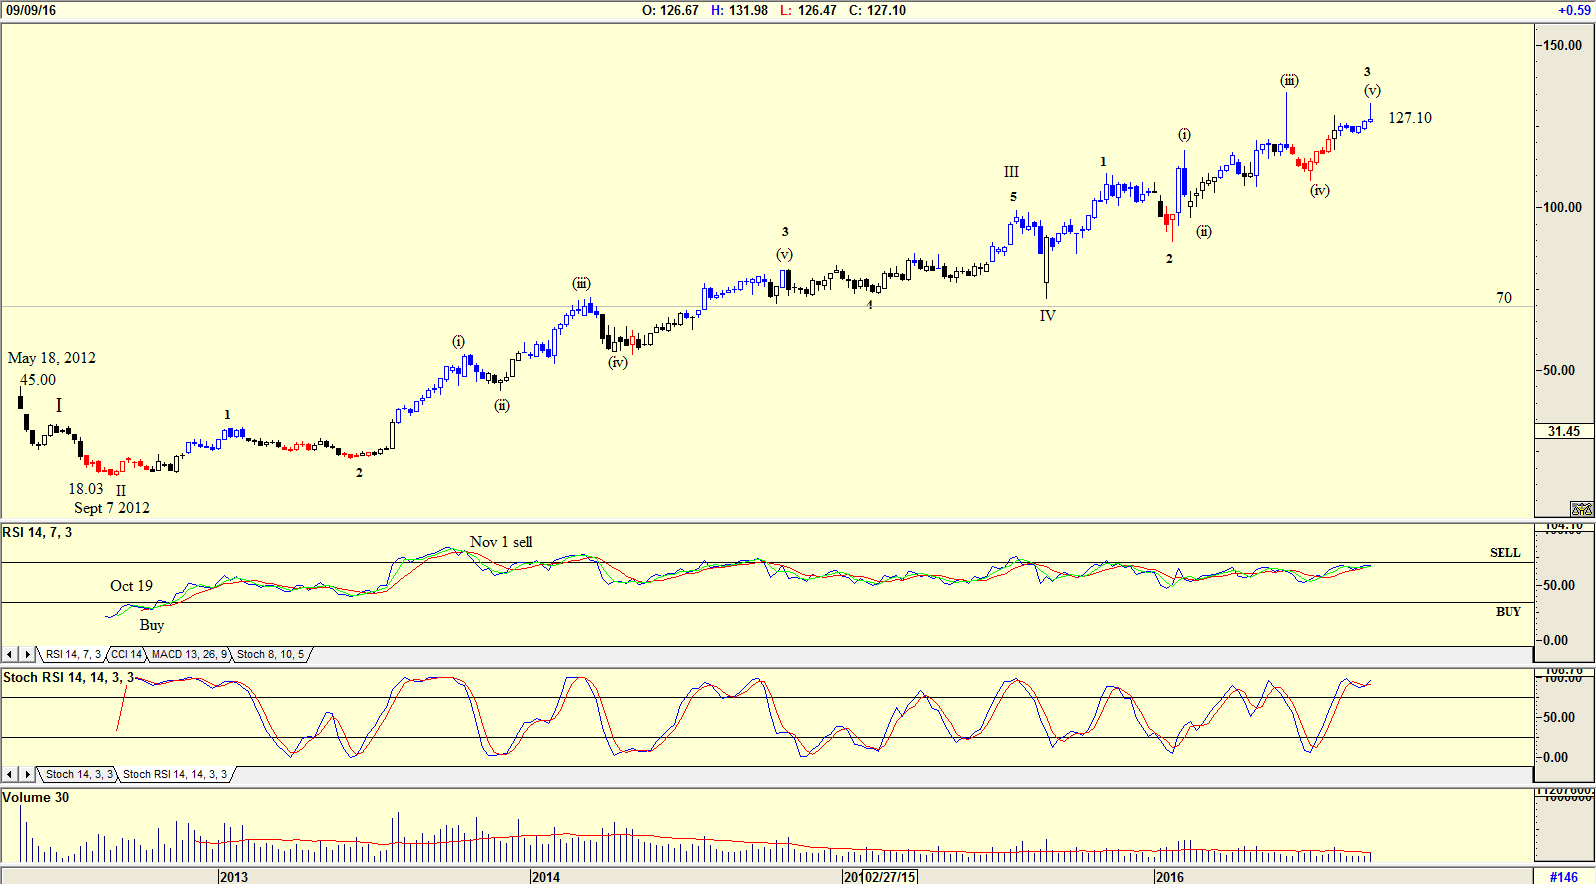
| The chart in Figure 1 is a weekly chart showing that Facebook listed on May 18th 2012, rising to a high of $45, but promptly falling to $18.03 by September 7th. From that date the share price has risen to the price of $127.10 on September 9th 2016. The chart shows two indicators. The RSI 14 period which gave a buy signal on October 19th 2012 and suggested a sell on November 1st 2013. From that date, the indicator never suggested another buy and the share price continued to rise. The Stochastic RSI 14 period on the other hand gave continual buy and sell signals. What is a concern is that volume started to weaken during 2014 as the share price rose, suggesting that buyers were staying away from the share as the price rose above $70. |

|
| Figure 2. Daily Chart With Elliott Wave Count. |
| Graphic provided by: AdvancedGET. |
| |
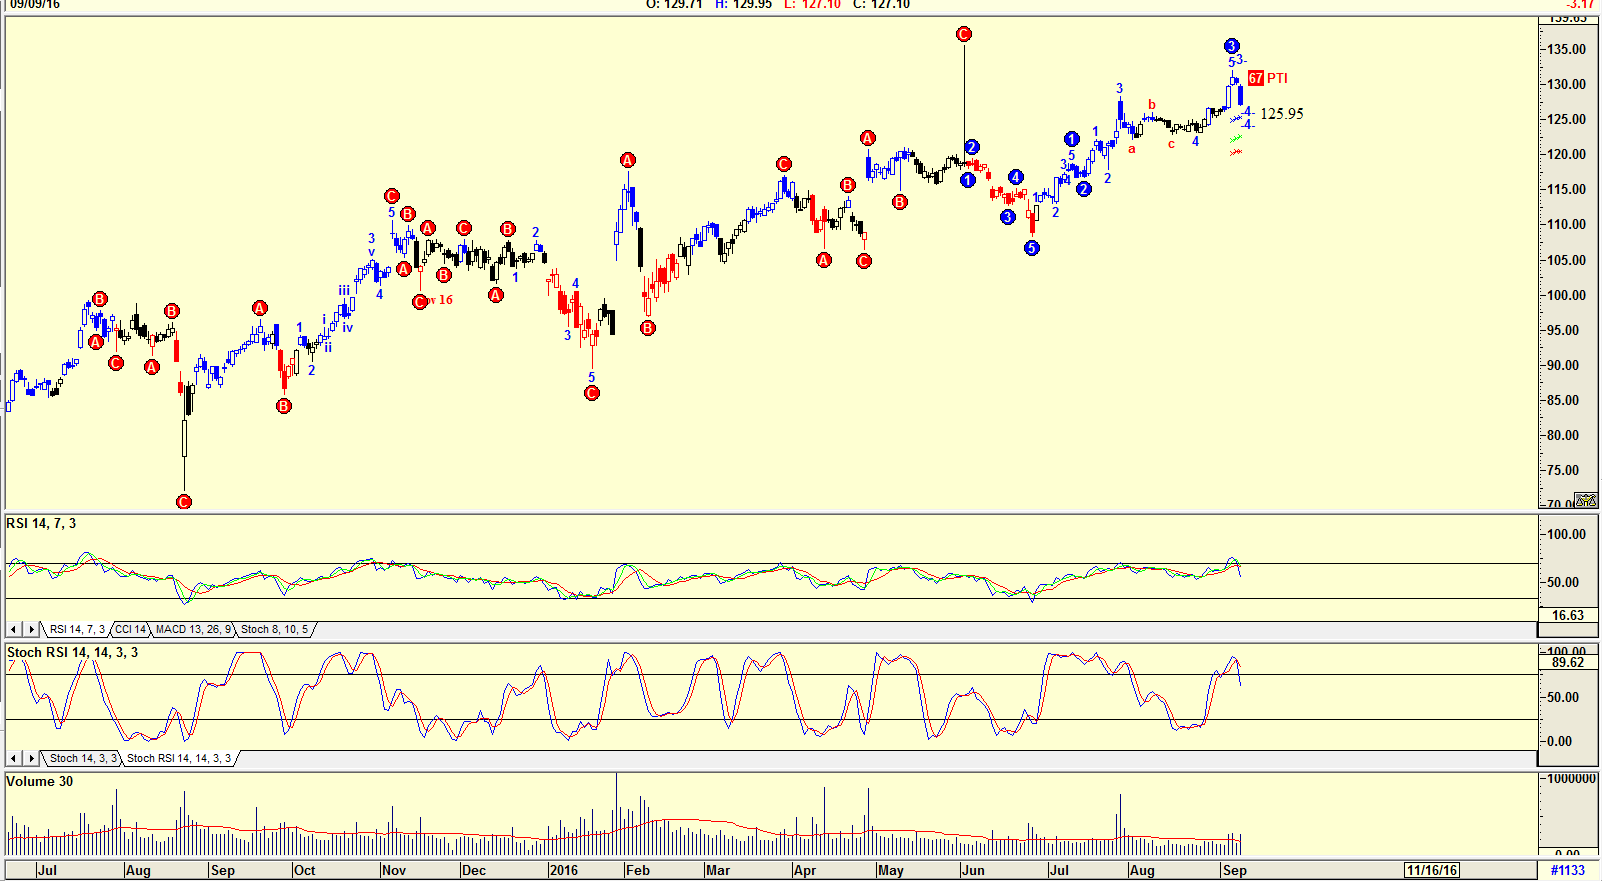
| The chart in Figure 2 is a daily chart with an Elliott wave count suggested by the Advanced GET program that is in itself, confusing. The count is suggesting that the share price could drop to $125.95 with PTI (Probability Index) suggesting 67, a comfortable figure. Both the RSI Index and the Stochastic RSI index have given sell signals, and volume has risen as the share price fell, suggesting weakness. |

|
| Figure 3. Daily Chart With JM Internal Band. |
| Graphic provided by: AdvancedGET. |
| |
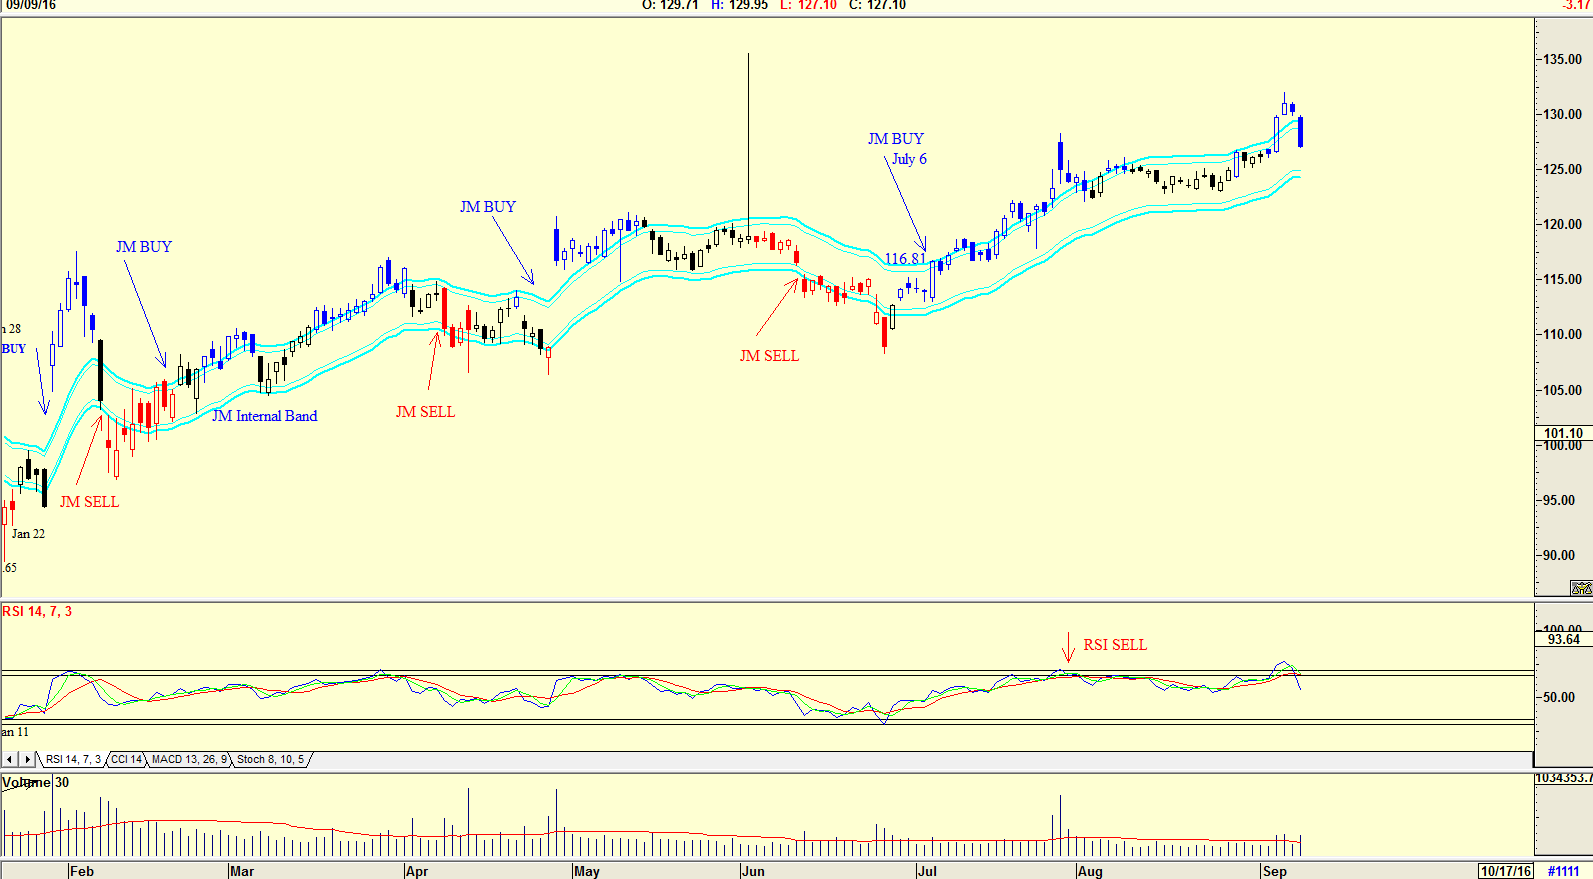
| The chart in Figure 3 is a daily chart with the JM Internal Band. The JM Internal Band is a 15 period simple moving average offset by 2% positive and 2% negative. A move above the upper band suggests a buy, and below the lower band a sekk. On July 6th, 2016, when the price was $116.81, the share price touched the upper band, suggesting a possible buy; confirmed 3 days later when the share price rose above the upper band. From that date the share price has risen, flirting all the time with the upper band, but not suggesting a sell signal by moving below the lower band, even though the RSI Indicator has suggested a sell signal. With the indexes suggesting weakness on Friday, September 10th, buying Facebook is doubtful. Waiting for a rise in price or a buy signal triggered by the RSI indicator is preferable. Investors could closely watch movement within the JM Internal Band. |
Has been a technical analyst since 1969, and has worked as a futures and options trader with First Financial Futures in Johannesburg, South Africa.
| Address: | 3256 West 24th Ave |
| Vancouver, BC | |
| Phone # for sales: | 6042634214 |
| E-mail address: | petroosp@gmail.com |
Click here for more information about our publications!
PRINT THIS ARTICLE

Request Information From Our Sponsors
- StockCharts.com, Inc.
- Candle Patterns
- Candlestick Charting Explained
- Intermarket Technical Analysis
- John Murphy on Chart Analysis
- John Murphy's Chart Pattern Recognition
- John Murphy's Market Message
- MurphyExplainsMarketAnalysis-Intermarket Analysis
- MurphyExplainsMarketAnalysis-Visual Analysis
- StockCharts.com
- Technical Analysis of the Financial Markets
- The Visual Investor
- VectorVest, Inc.
- Executive Premier Workshop
- One-Day Options Course
- OptionsPro
- Retirement Income Workshop
- Sure-Fire Trading Systems (VectorVest, Inc.)
- Trading as a Business Workshop
- VectorVest 7 EOD
- VectorVest 7 RealTime/IntraDay
- VectorVest AutoTester
- VectorVest Educational Services
- VectorVest OnLine
- VectorVest Options Analyzer
- VectorVest ProGraphics v6.0
- VectorVest ProTrader 7
- VectorVest RealTime Derby Tool
- VectorVest Simulator
- VectorVest Variator
- VectorVest Watchdog
