HOT TOPICS LIST
- MACD
- Fibonacci
- RSI
- Gann
- ADXR
- Stochastics
- Volume
- Triangles
- Futures
- Cycles
- Volatility
- ZIGZAG
- MESA
- Retracement
- Aroon
INDICATORS LIST
LIST OF TOPICS
PRINT THIS ARTICLE
by Koos van der Merwe
With market uncertainty triggered by a possible interest rate increase and a controversial Presidential election, finding a share that could be a buy is not that easy.
Position: Buy
Koos van der Merwe
Has been a technical analyst since 1969, and has worked as a futures and options trader with First Financial Futures in Johannesburg, South Africa.
PRINT THIS ARTICLE
TECHNICAL ANALYSIS
Community Health Systems
09/07/16 03:25:55 PMby Koos van der Merwe
With market uncertainty triggered by a possible interest rate increase and a controversial Presidential election, finding a share that could be a buy is not that easy.
Position: Buy
| On my analysis program, analyzing the results of Friday September 2nd trades, only one share out of close to 2500 shares analyzed, came up as a possible buy. The share is Community Health Systems, one of the nation's leading operators of general acute care hospitals. With the uncertainty as to whether interest rates will be increased in September, or even later in this year, this past week gave an indication of how the market could react. So, should one buy shares or simply sit on cash, and wait to see what happens over the next four months; as to who will be the next US President, or what Janet Yellen, Chairman of the Federal Reserve will announce. Whatever your decision, Community Health Systems is a share to watch. |

|
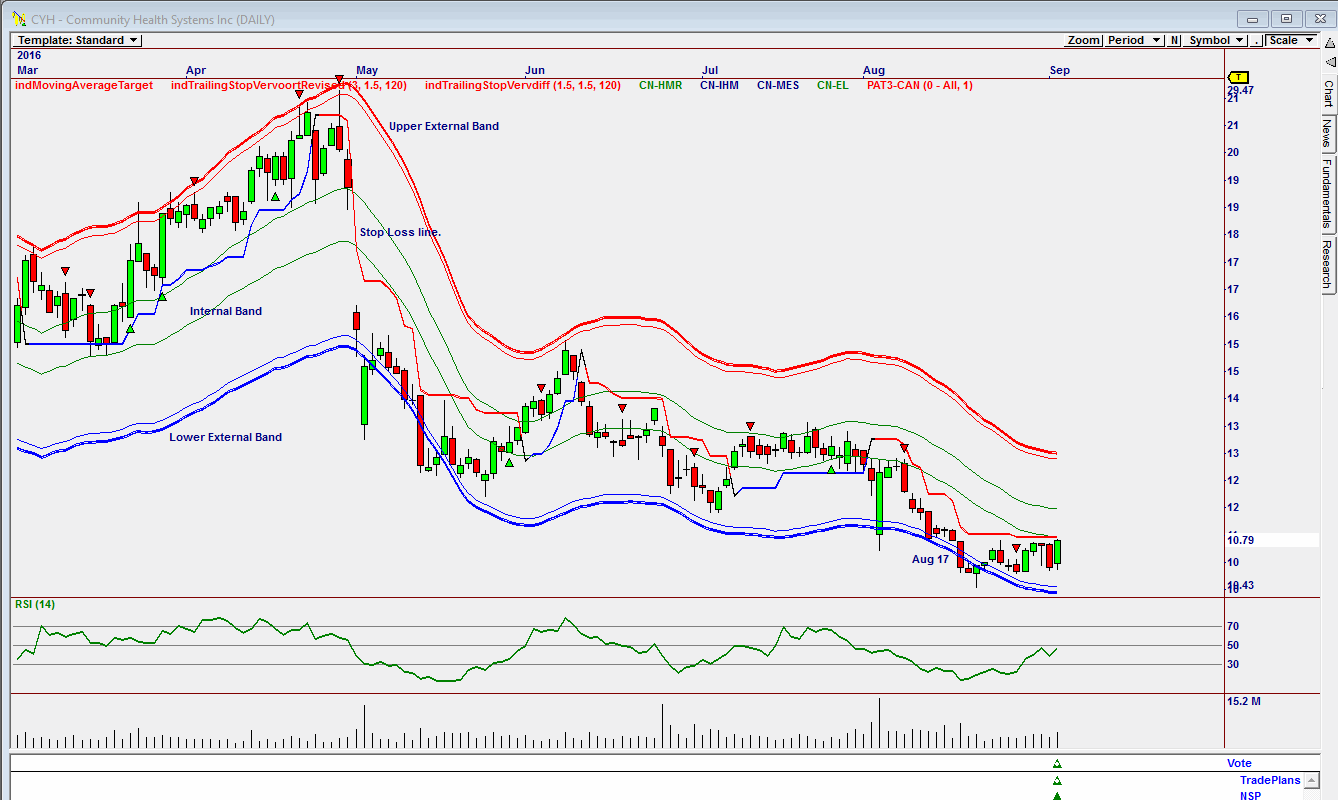
| Figure 1. Chart showing a Vote line buy. |
| Graphic provided by: Omnitrader. |
| |
| The chart in Figure 1 is an Omnitrader chart showing a buy signal given on the Vote line. Looking at the chart one can see the share price tested the Lower External band on August 17th, and moved sideways, rising strongly on Friday. September 2nd. Do note that the RSI 14 indicator has given a buy falling below and then rising above the 30 horizontal line, and is trending up. Also note volume, which rose on September 2nd as the price rose, signalling strength. The FTH (Forward Test Hit Rate) shown on the chart is 78 which is very strong. The FTNL (Forward Test Longs) Is 8, and the FTNS (Forward Test Short) is only at 1 suggesting that buying the share for a long is better than selling the share short. The FTProf (Forward Test Profitability) suggests that there is a 23% chance of the trade being profitable, not as high as I would like, but worth looking at. |

|
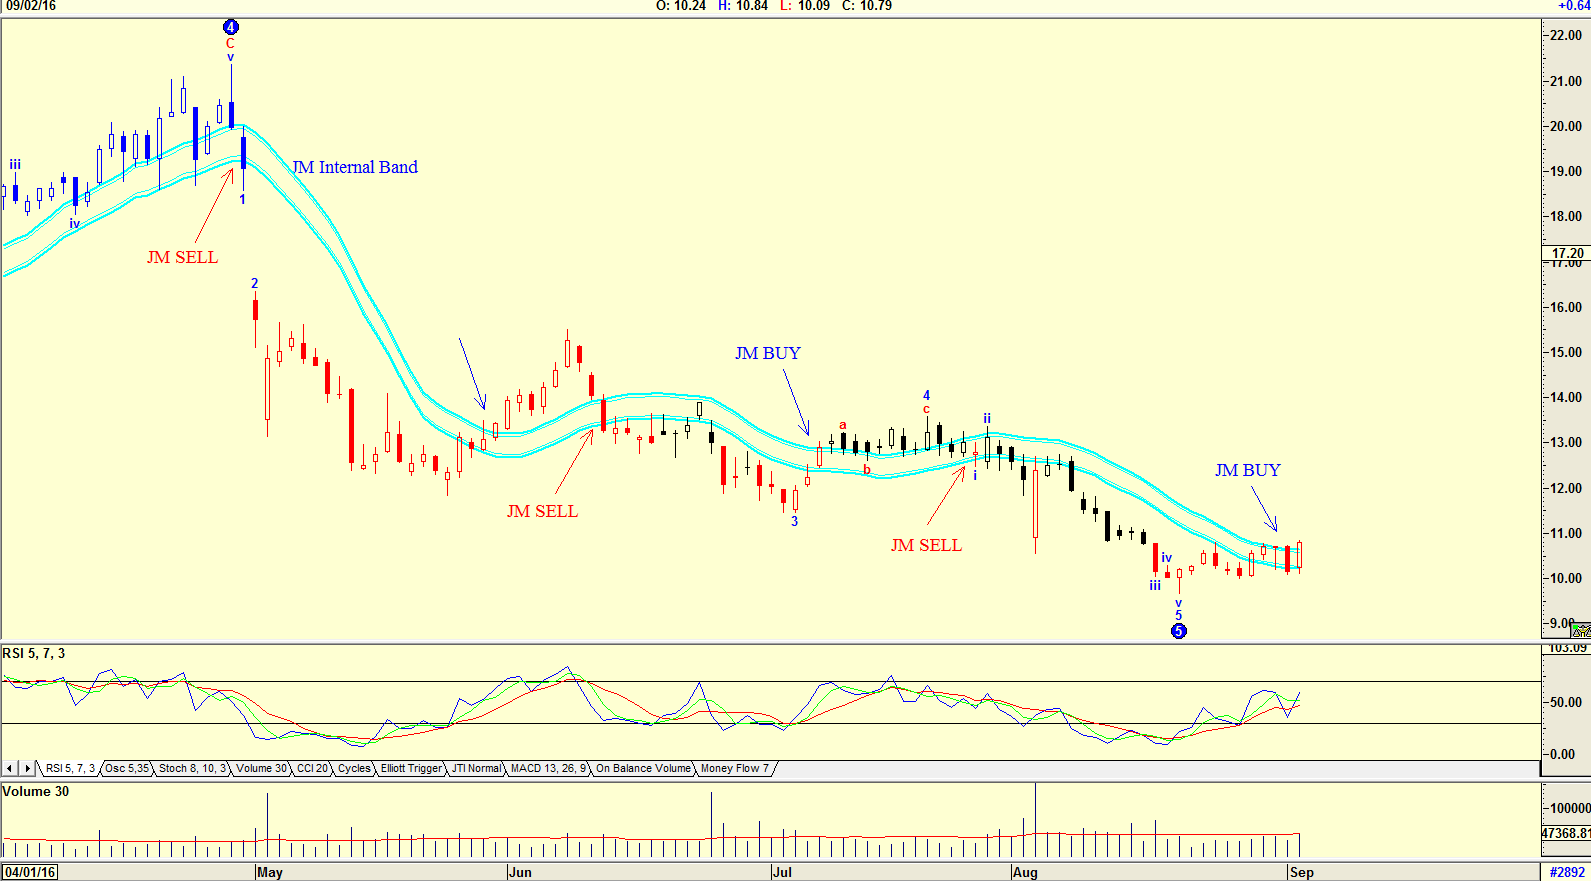
| Figure 2. Daily chart showing a JM Internal Band buy. |
| Graphic provided by: AdvancedGET. |
| |
| The chart of Figure 2 is a chart showing the JM Internal Band with a buy signal given on September 2nd. The JM Internal Band in a 15-period simple moving average offset by 2% plus and 2% negative. A move above the upper band suggests a buy and below the lower band a sell. So, do you simply buy the share? With a buy signal breaking above the upper JM Internal Band, the answer is "YES", the risk offered by a JM Buy is low. Cautious investors, on the other hand, could buy a call option with a strike one month out. |
Has been a technical analyst since 1969, and has worked as a futures and options trader with First Financial Futures in Johannesburg, South Africa.
| Address: | 3256 West 24th Ave |
| Vancouver, BC | |
| Phone # for sales: | 6042634214 |
| E-mail address: | petroosp@gmail.com |
Click here for more information about our publications!
PRINT THIS ARTICLE

|

Request Information From Our Sponsors
- VectorVest, Inc.
- Executive Premier Workshop
- One-Day Options Course
- OptionsPro
- Retirement Income Workshop
- Sure-Fire Trading Systems (VectorVest, Inc.)
- Trading as a Business Workshop
- VectorVest 7 EOD
- VectorVest 7 RealTime/IntraDay
- VectorVest AutoTester
- VectorVest Educational Services
- VectorVest OnLine
- VectorVest Options Analyzer
- VectorVest ProGraphics v6.0
- VectorVest ProTrader 7
- VectorVest RealTime Derby Tool
- VectorVest Simulator
- VectorVest Variator
- VectorVest Watchdog
- StockCharts.com, Inc.
- Candle Patterns
- Candlestick Charting Explained
- Intermarket Technical Analysis
- John Murphy on Chart Analysis
- John Murphy's Chart Pattern Recognition
- John Murphy's Market Message
- MurphyExplainsMarketAnalysis-Intermarket Analysis
- MurphyExplainsMarketAnalysis-Visual Analysis
- StockCharts.com
- Technical Analysis of the Financial Markets
- The Visual Investor
