HOT TOPICS LIST
- MACD
- Fibonacci
- RSI
- Gann
- ADXR
- Stochastics
- Volume
- Triangles
- Futures
- Cycles
- Volatility
- ZIGZAG
- MESA
- Retracement
- Aroon
INDICATORS LIST
LIST OF TOPICS
PRINT THIS ARTICLE
by Koos van der Merwe
Investor money flows to gold shares as a safe haven. With gold shares and ETF's starting to look attractive, what are they telling us?
Position: Buy
Koos van der Merwe
Has been a technical analyst since 1969, and has worked as a futures and options trader with First Financial Futures in Johannesburg, South Africa.
PRINT THIS ARTICLE
TECHNICAL ANALYSIS
Where Is Gold Going?
09/07/16 03:15:44 PMby Koos van der Merwe
Investor money flows to gold shares as a safe haven. With gold shares and ETF's starting to look attractive, what are they telling us?
Position: Buy
| After Federal Reserve Chairwoman Janet Yellen remarked at the annual economic symposium in Jackson Hole that the case for an increase in the U.S. short term interest rate has strengthened in recent months, stocks notched their biggest weekly declines since Brexit. The Dow fell 53.01 points with all the indexes showing their largest losses since the week ending June 24th, when the UK voted to leave the European Union. However, looking at charts of Gold ETF's, they are all suggesting that they are oversold, and hinting at a buy. Should one start nibbling at them? A look at the four charts shown below gives a hint at what one should do. |

|
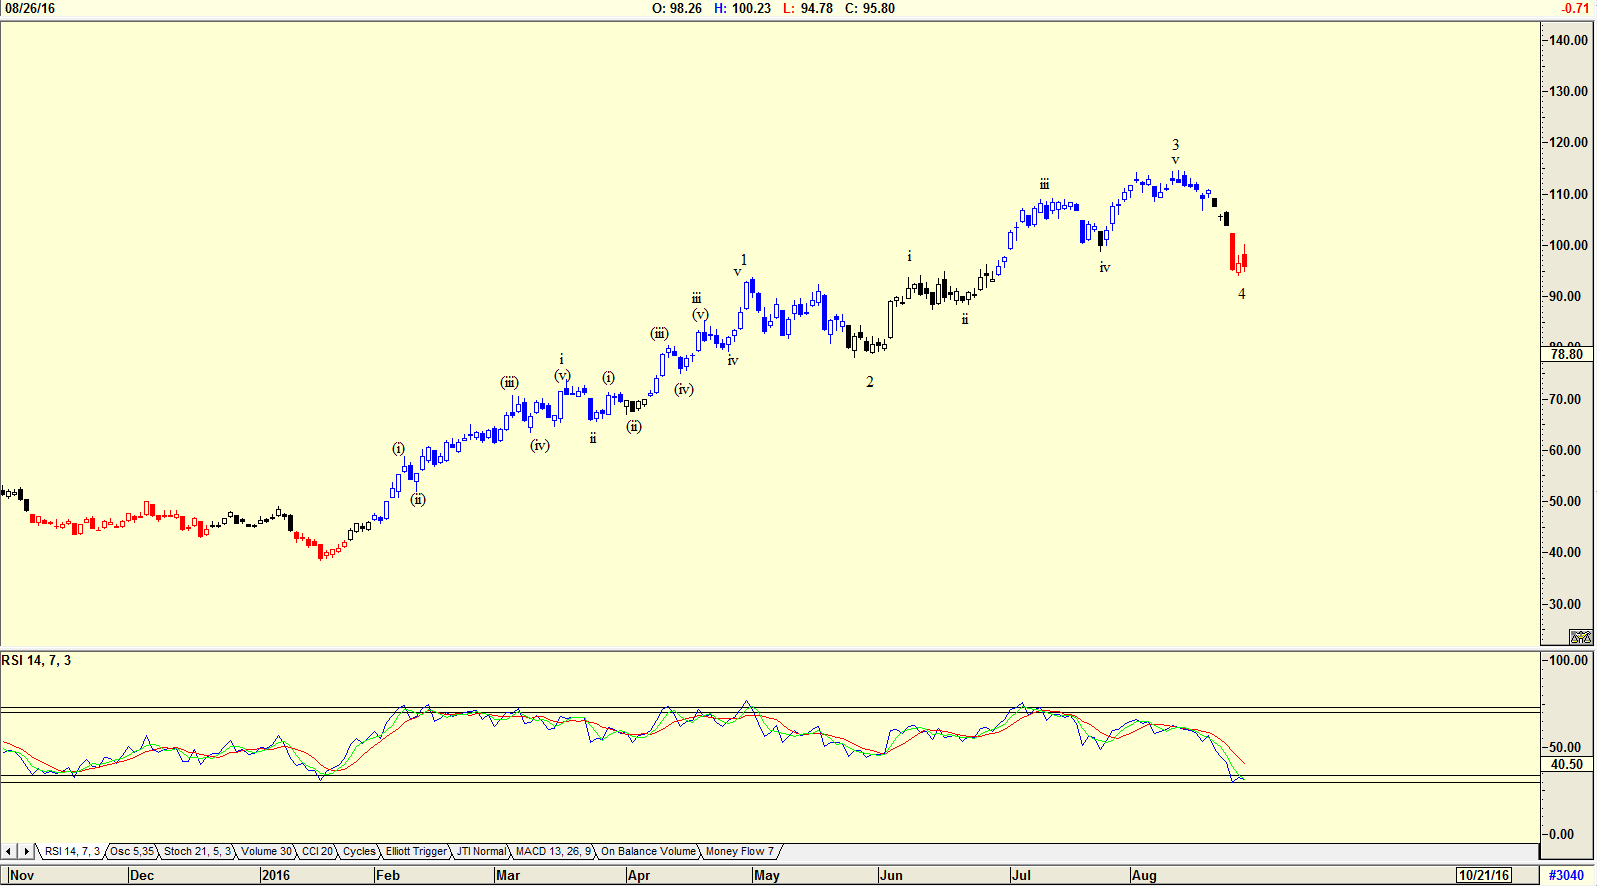
| Figure 1. Gold and Silver Index. |
| Graphic provided by: AdvancedGET. |
| |
| The chart in Figure 1 is a daily chart of the Gold and Silver Index. The chart has an Elliott wave count suggesting that the index is completing a Wave 4 and should start rising. This is confirmed by the RSI index which is at oversold levels. Do note that Wave 3 is shorter than Wave 1, which means that Wave 5 will be shorter than Wave 3. |

|
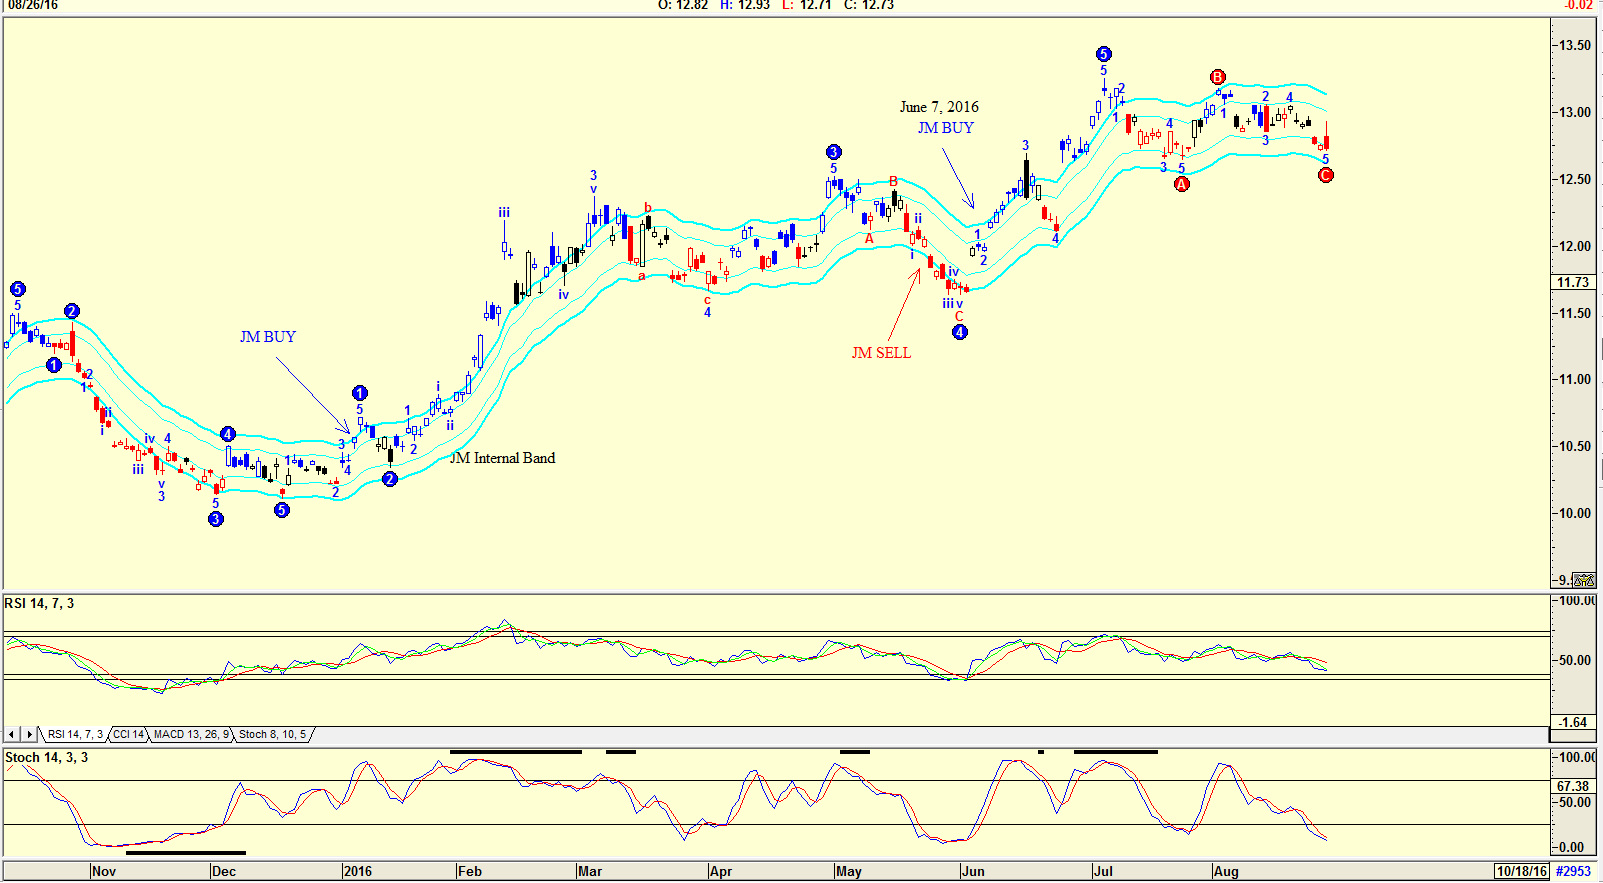
| Figure 2. iShares GOLD. |
| Graphic provided by: AdvancedGET. |
| |
| The chart in Figure 2 is a daily chart of iShares GOLD. The chart shows an Elliott wave count suggesting that a WAVE 5 with an ABC correction is now complete, and that the price should start rising in a new Wave 1. Do note the two indicators; The RSI has not yet reached oversold levels, while the Stochastic is at oversold levels, but has not yet given a buy signal. The JM Internal Band shown on the chart gave a buy signal on June 7th 2016. It has, however, not given a sell signal. The JM Internal Band is a 15-period simple moving average offset by 2% positive and 2% negative, A move above the upper band suggests a buy and below the lower band a sell. |

|
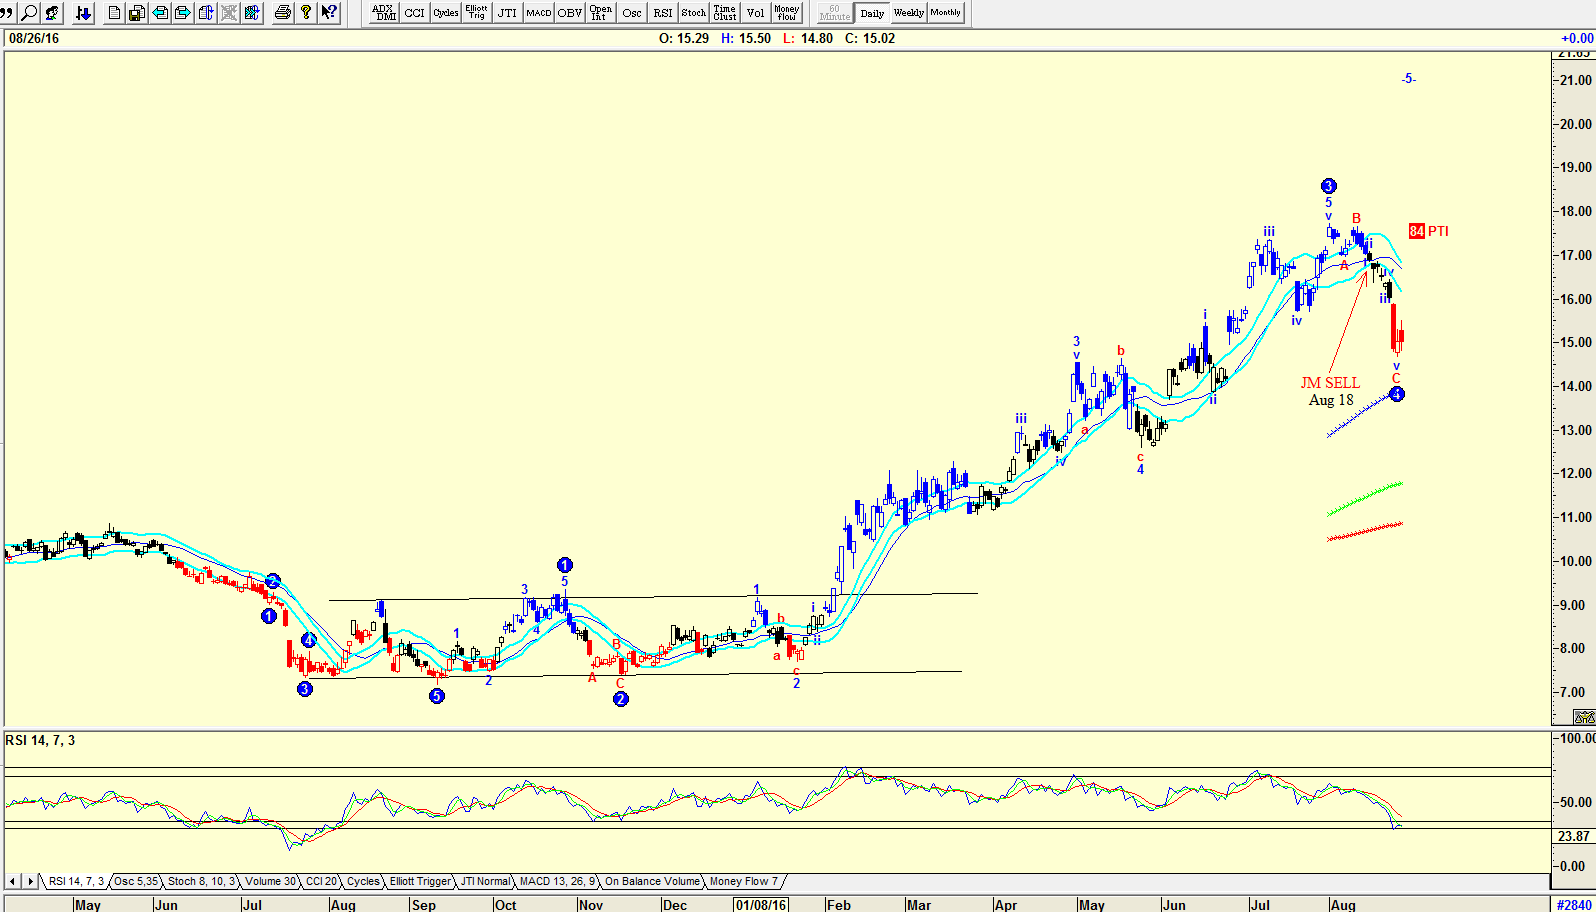
| Figure 3. i-Unit Gold Index. |
| Graphic provided by: AdvancedGET. |
| |
| The chart in Figure 3 is a daily chart of the i-Unit Gold Index with an Elliott wave count suggesting that the chart has completed a WAVE 4 and should start rising in a WAVE 5. The PTI (probability Index) is 84 which is high. Do note the RSI indicator which is at oversold levels and suggesting a buy. The JM Internal Band indicators also gave a sell signal on August 18th. |

|
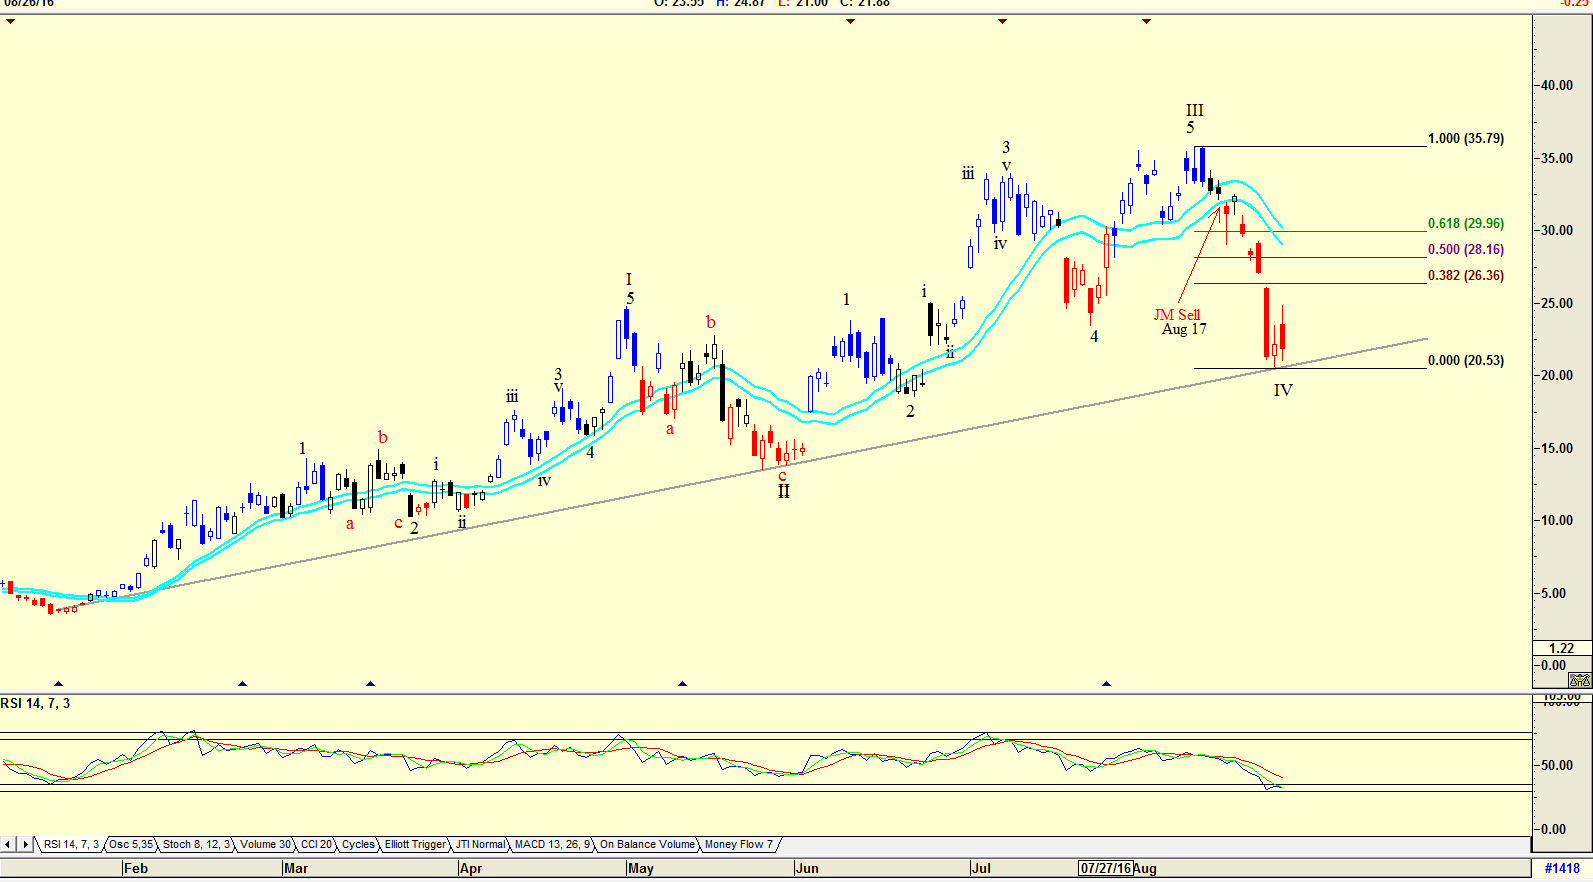
| Figure 4. Direxion Gold shares. |
| Graphic provided by: AdvancedGET. |
| |
| The chart is Figure 4 is a daily chart of Direxion Gold Mining. The price follows the Gold price and is suggesting that an Elliott Wave IV is complete and that the price should start rising in a Wave V. This is confirmed by the RSI indicator which is at oversold levels. Do note the JM Internal Band sell signal given on August 17th. All the ETF's that reflect the Gold price are at oversold levels and suggesting a move up in the near future. With Gold moving up, the US Market is hinting at a drop. Going for gold looks like the strategy of today. |
Has been a technical analyst since 1969, and has worked as a futures and options trader with First Financial Futures in Johannesburg, South Africa.
| Address: | 3256 West 24th Ave |
| Vancouver, BC | |
| Phone # for sales: | 6042634214 |
| E-mail address: | petroosp@gmail.com |
Click here for more information about our publications!
PRINT THIS ARTICLE

Request Information From Our Sponsors
- StockCharts.com, Inc.
- Candle Patterns
- Candlestick Charting Explained
- Intermarket Technical Analysis
- John Murphy on Chart Analysis
- John Murphy's Chart Pattern Recognition
- John Murphy's Market Message
- MurphyExplainsMarketAnalysis-Intermarket Analysis
- MurphyExplainsMarketAnalysis-Visual Analysis
- StockCharts.com
- Technical Analysis of the Financial Markets
- The Visual Investor
- VectorVest, Inc.
- Executive Premier Workshop
- One-Day Options Course
- OptionsPro
- Retirement Income Workshop
- Sure-Fire Trading Systems (VectorVest, Inc.)
- Trading as a Business Workshop
- VectorVest 7 EOD
- VectorVest 7 RealTime/IntraDay
- VectorVest AutoTester
- VectorVest Educational Services
- VectorVest OnLine
- VectorVest Options Analyzer
- VectorVest ProGraphics v6.0
- VectorVest ProTrader 7
- VectorVest RealTime Derby Tool
- VectorVest Simulator
- VectorVest Variator
- VectorVest Watchdog
