HOT TOPICS LIST
- MACD
- Fibonacci
- RSI
- Gann
- ADXR
- Stochastics
- Volume
- Triangles
- Futures
- Cycles
- Volatility
- ZIGZAG
- MESA
- Retracement
- Aroon
INDICATORS LIST
LIST OF TOPICS
PRINT THIS ARTICLE
by Koos van der Merwe
Disney has 13 movies coming out in 2016.
Position: Accumulate
Koos van der Merwe
Has been a technical analyst since 1969, and has worked as a futures and options trader with First Financial Futures in Johannesburg, South Africa.
PRINT THIS ARTICLE
ELLIOTT WAVE
Disney
08/18/16 03:23:01 PMby Koos van der Merwe
Disney has 13 movies coming out in 2016.
Position: Accumulate
| Disney had a big year in 2015 with two Pixar movies, and 2016 looks as though it will be even bigger with the studio releasing its official list of movies. After the success of Cinderella, the company released a list of its planned movie release for the coming four years. On June 29th, 2016, the company declared a semi-annual cash dividend of $0.71 per share. With the share price presently at $96.84 this is a yield of 1.47%. On August 9th the company reported quarterly earnings of $2.6 billion for its third fiscal quarter ending July 2, 2016, an increase of $114 million over the prior year quarter. "We are thrilled with our continued performance," Robert A Iger, the Chairman and Chief Executive Officer said. |

|
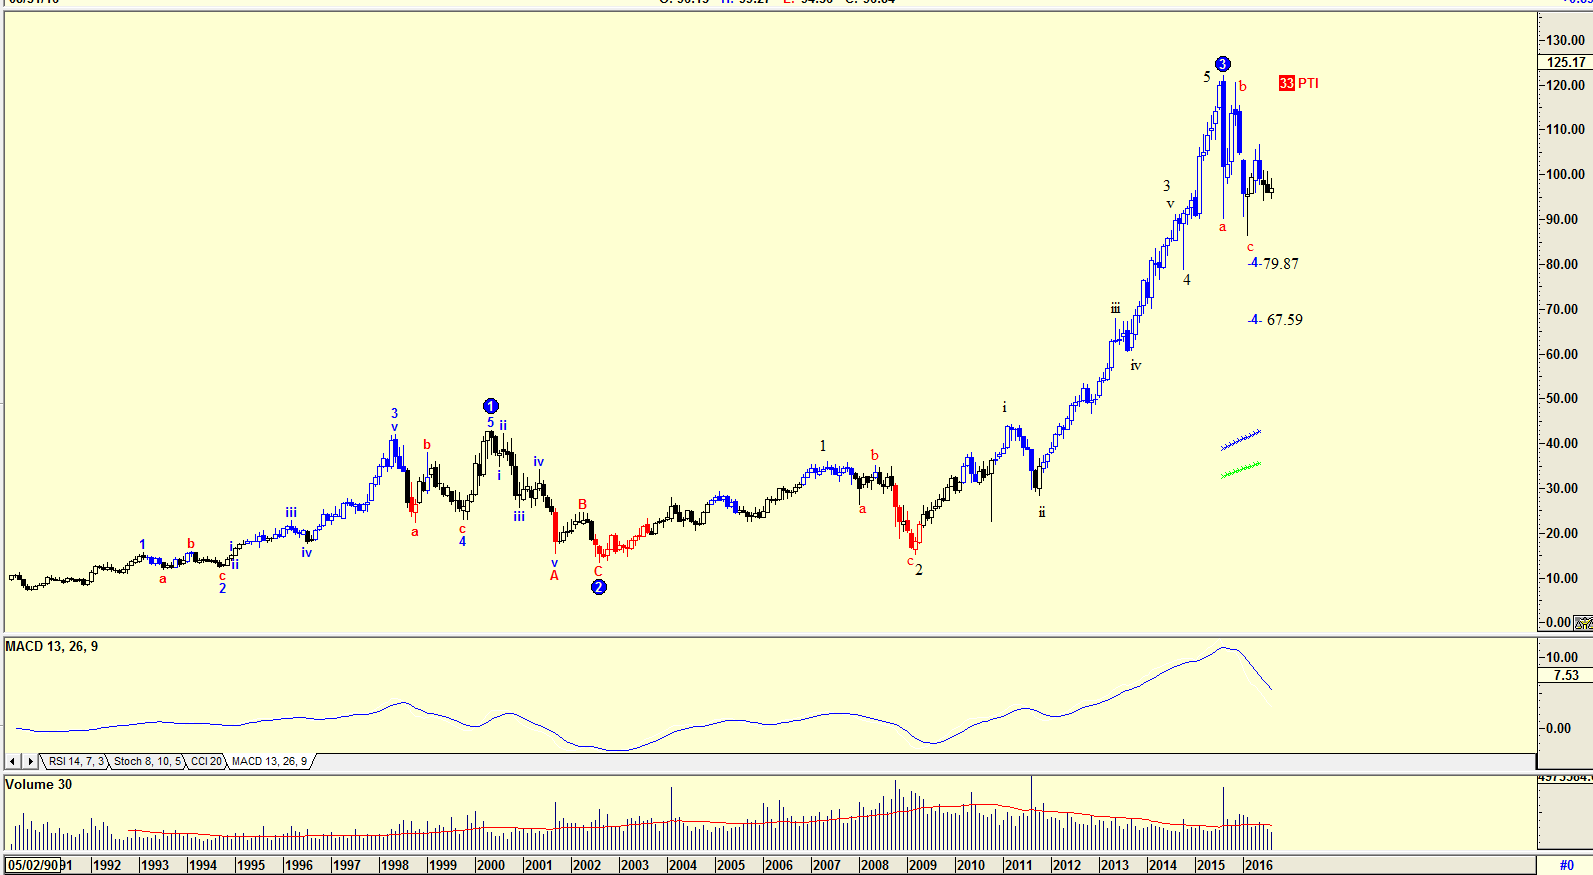
| Figure 1. Monthly chart with Elliott wave count. |
| Graphic provided by: AdvancedGET. |
| |
| The chart in Figure 1 is a monthly chart with an Elliott wave count suggesting that the share price is in a WAVE 4 correction. Targets suggested are $79.87 or $67.59. With the PTI (Probability Index) at only 33, the likelihood of the share price falling to $67.59 is the most likely. The MACD indicator is also suggesting a fall to the lower target. However, volume has been falling as the share price fell, suggesting strength, possibly the result of fewer sellers as the financial results and future growth prospects were released. |

|
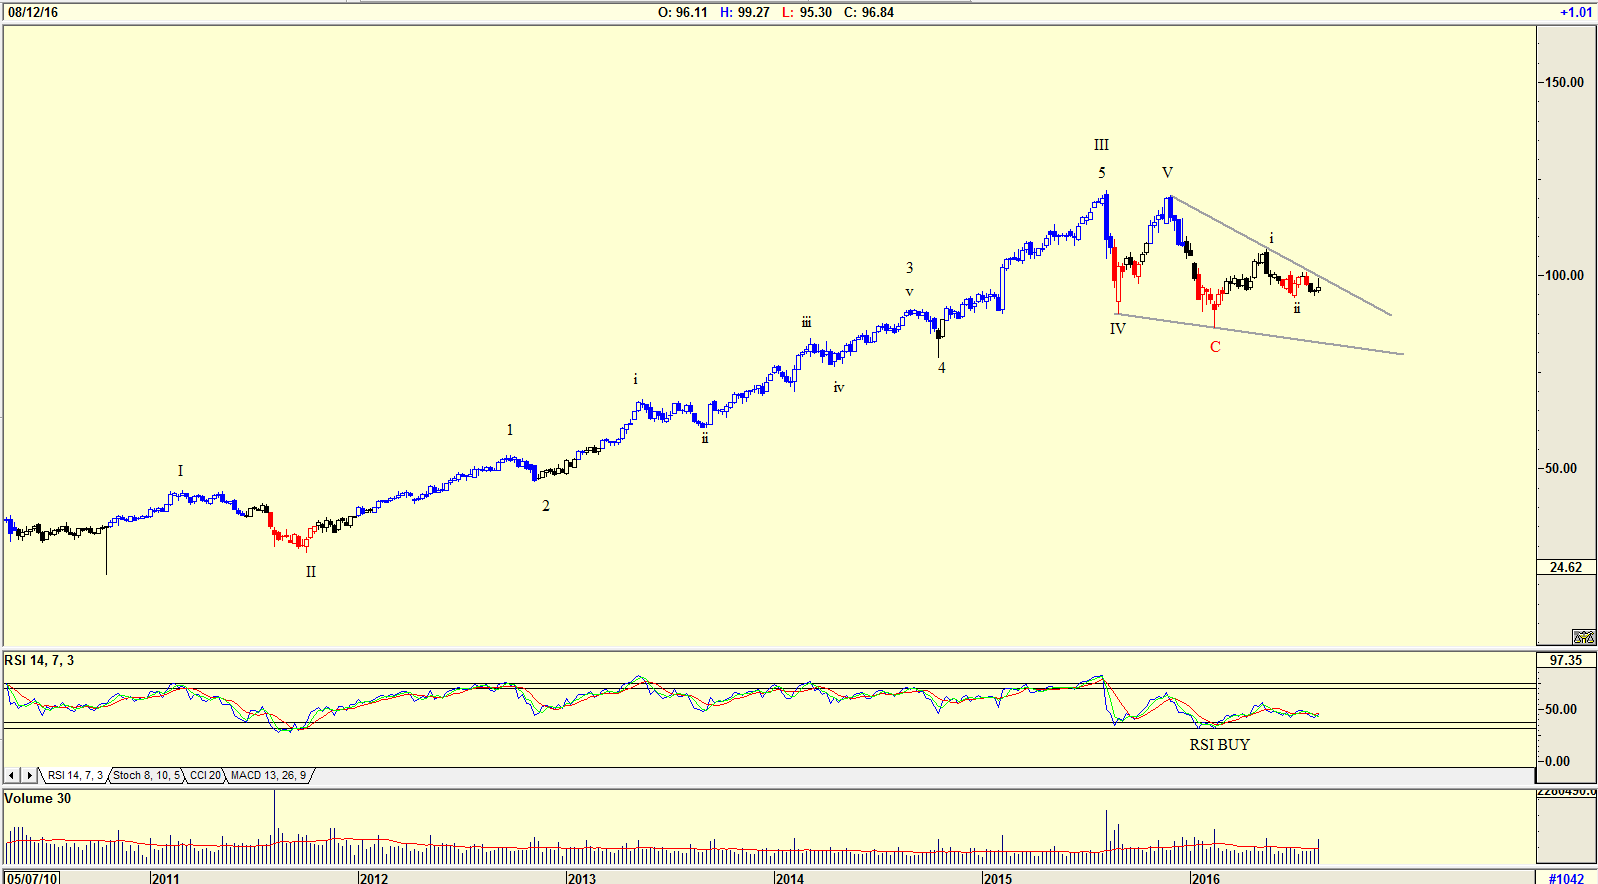
| Figure 2. Weekly chart with Elliott wave count. |
| Graphic provided by: AdvancedGET. |
| |
| Figure 2 shows a weekly chart confirming the correction suggested by the monthly chart in Figure 1. The chart does suggest a wave 5 failure, a procedure that is becoming more and more common as computers become more dominant in market trading. The RSI indicator is suggesting that a buy signal has been given, and the Elliott wave count is suggesting that the share price could be in a wave iii upwards. However, this will only be confirmed when the share price breaks above the downward sloping resistance line. Do note that volume did rise as the share price rose, suggesting strength. |

|
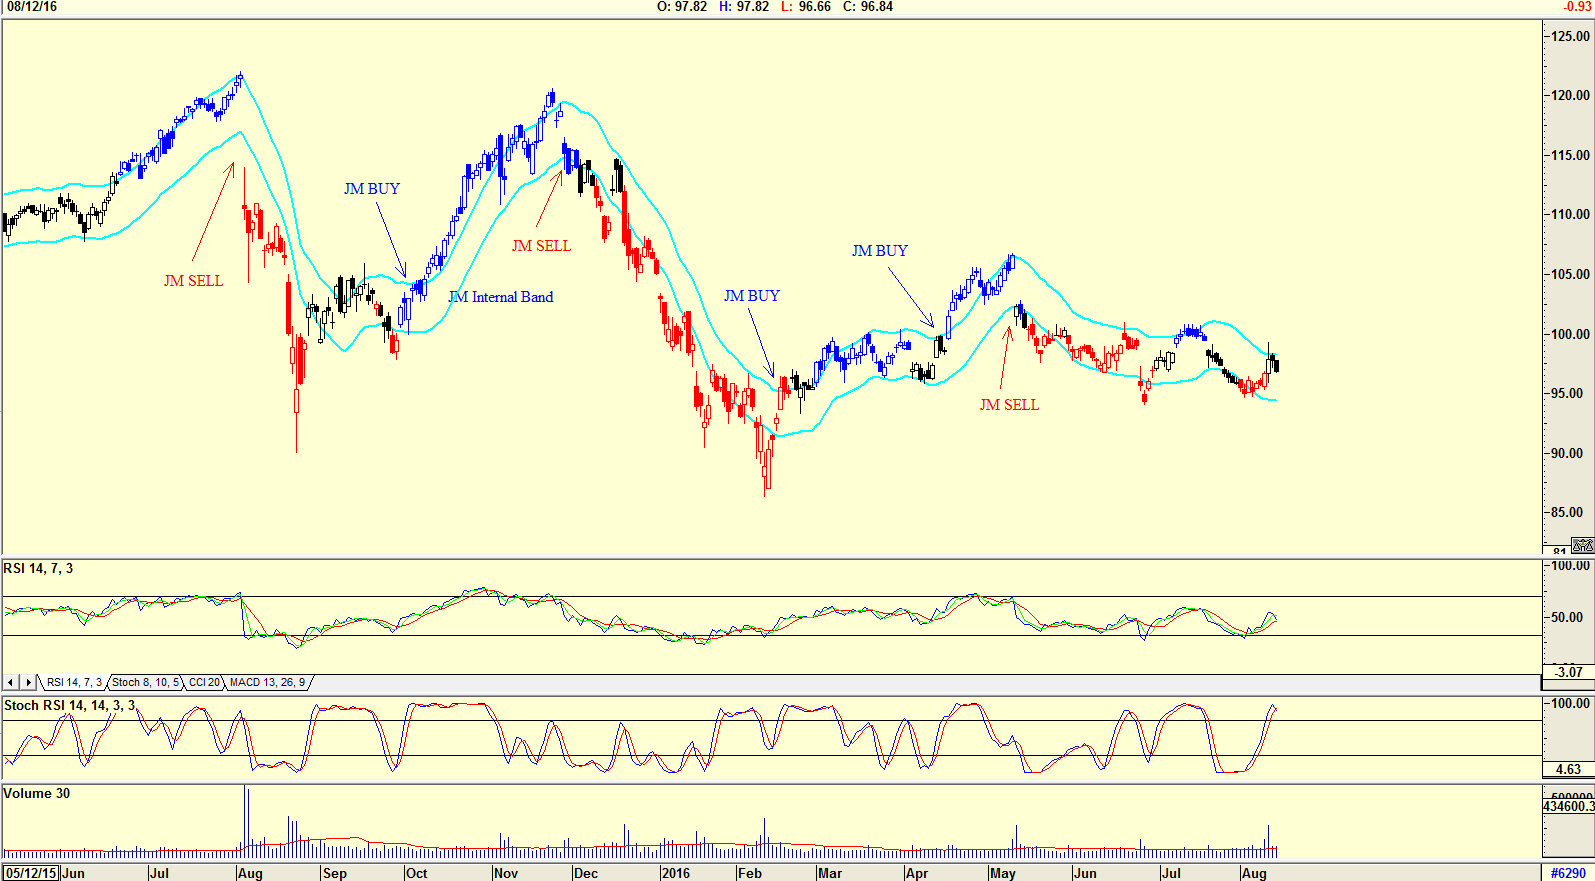
| Figure 3. Daily chart with JM Internal Band. |
| Graphic provided by: AdvancedGET. |
| |
| Finally, the chart in Figure 3 is a daily chart with a JM Internal band not suggesting a buy. The JM Internal band is a 15 period simple moving average offset by 2% positive and 2% negative. A move above the upper band suggests a buy and below the lower band a sell. The RSI indicator has given a BUY, but the Stochastic RSI is suggesting weakness. Waiting for the Stochastic RSI to reach oversold levels before buying could be the way to go for traders, but investors could wait for a move above the upper JM Internal band before buying. Disney is a share that I would place on my watch list. With the list of future movies for the coming years, and the success of the movies so far released in 2016, this is a share one should buy on the correction and hold for the very long term. |
Has been a technical analyst since 1969, and has worked as a futures and options trader with First Financial Futures in Johannesburg, South Africa.
| Address: | 3256 West 24th Ave |
| Vancouver, BC | |
| Phone # for sales: | 6042634214 |
| E-mail address: | petroosp@gmail.com |
Click here for more information about our publications!
PRINT THIS ARTICLE

Request Information From Our Sponsors
- VectorVest, Inc.
- Executive Premier Workshop
- One-Day Options Course
- OptionsPro
- Retirement Income Workshop
- Sure-Fire Trading Systems (VectorVest, Inc.)
- Trading as a Business Workshop
- VectorVest 7 EOD
- VectorVest 7 RealTime/IntraDay
- VectorVest AutoTester
- VectorVest Educational Services
- VectorVest OnLine
- VectorVest Options Analyzer
- VectorVest ProGraphics v6.0
- VectorVest ProTrader 7
- VectorVest RealTime Derby Tool
- VectorVest Simulator
- VectorVest Variator
- VectorVest Watchdog
- StockCharts.com, Inc.
- Candle Patterns
- Candlestick Charting Explained
- Intermarket Technical Analysis
- John Murphy on Chart Analysis
- John Murphy's Chart Pattern Recognition
- John Murphy's Market Message
- MurphyExplainsMarketAnalysis-Intermarket Analysis
- MurphyExplainsMarketAnalysis-Visual Analysis
- StockCharts.com
- Technical Analysis of the Financial Markets
- The Visual Investor
