HOT TOPICS LIST
- MACD
- Fibonacci
- RSI
- Gann
- ADXR
- Stochastics
- Volume
- Triangles
- Futures
- Cycles
- Volatility
- ZIGZAG
- MESA
- Retracement
- Aroon
INDICATORS LIST
LIST OF TOPICS
PRINT THIS ARTICLE
by Koos van der Merwe
When a share collapses in price, should you buy it?
Position: Accumulate
Koos van der Merwe
Has been a technical analyst since 1969, and has worked as a futures and options trader with First Financial Futures in Johannesburg, South Africa.
PRINT THIS ARTICLE
ELLIOTT WAVE
Buying With Bill Ackman
08/17/16 04:08:02 PMby Koos van der Merwe
When a share collapses in price, should you buy it?
Position: Accumulate
| Valeant Pharmaceuticals International, Inc. is a Pharmaceutical Company based in Quebec, Canada. Bill Ackman, the hedge fund manager well known for his demand that the company Herbalife be branded a pyramid scheme, invested in Valeant Pharmaceuticals, joining its board on March 21st. After suffering a huge price drop because of concerns over the company's practice of hiking drug prices, the company faced accusations of shady accounting and possible fraud. On October 21st 2015, short seller Andrew Left of Citron Research called the firm a "Pharmaceutical Enron" and sent the stock price tanking. On October 27th, 2015, Ackman sent an email to CFO Howard Schiller, "I don't think you are handling this correctly and the company is at risk of getting into a death spiral as a result." |

|
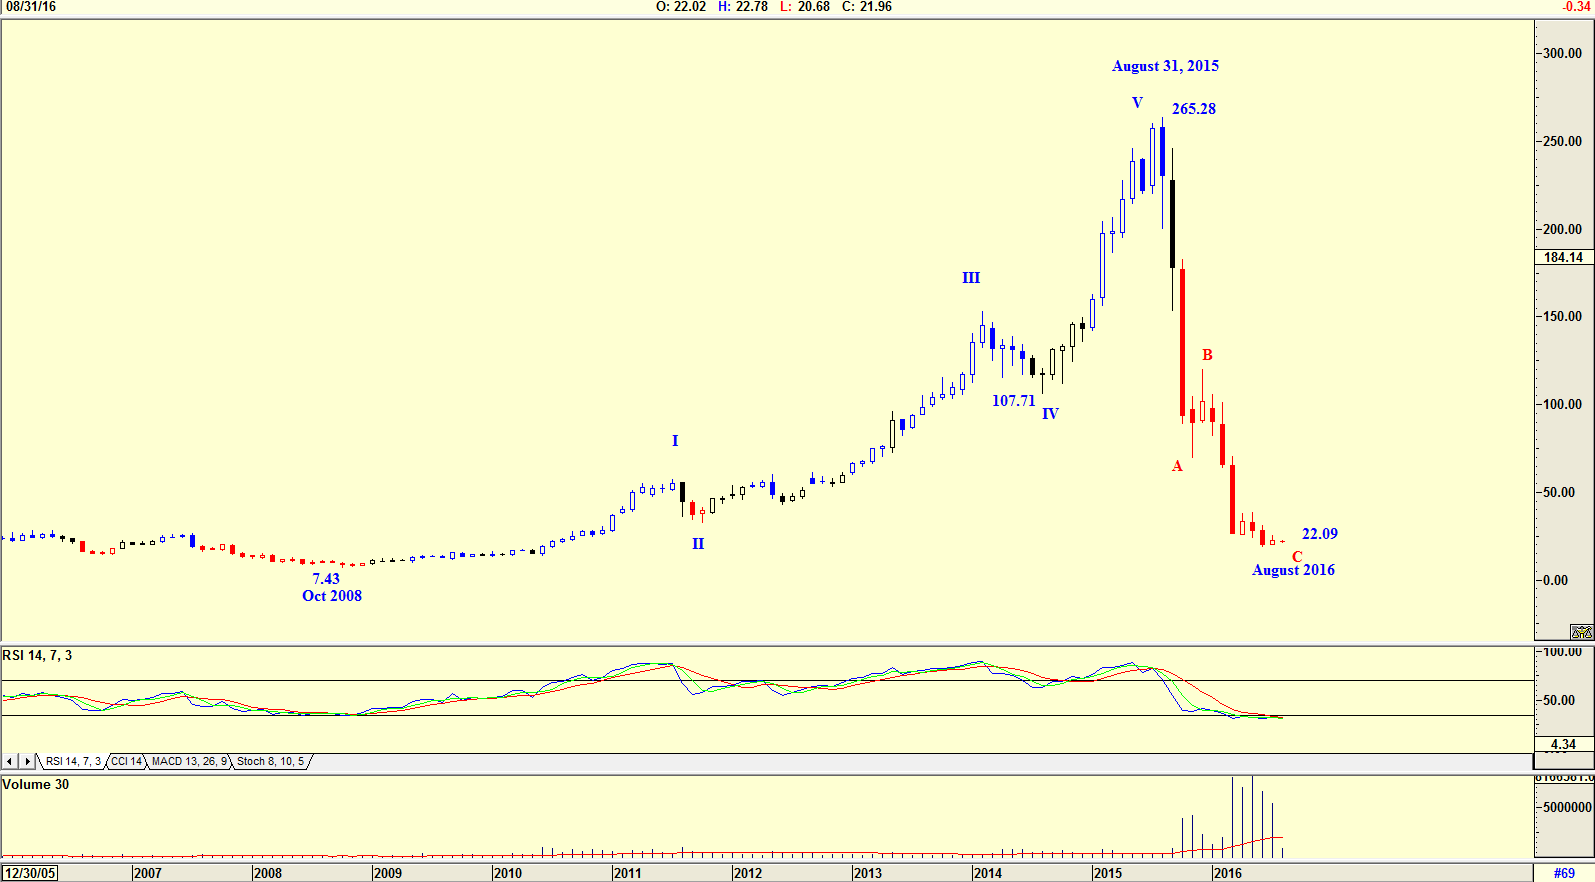
| Figure 1. Monthly chart showing Elliott wave count. |
| Graphic provided by: AdvancedGET. |
| |
| The chart in Figure 1 is a monthly chart showing how the share price rose from a low of $7.43 in October 2008 to a high of $265.28 by August 31st, 2015. The Elliott wave count suggests that the high of August 2015 is an Elliott Wave V and that an ABC correction was now on the cards. By Elliott wave theory, the correction should bottom at $107.71, the WAVE IV low, but the share price continued to tumble and appears to be bottoming at $22.09 in August 2016. Volume was above average as the share price fell, confirming the weakness. However, the RSI index is at oversold levels, suggesting that a buy could be triggered in the near future. |

|
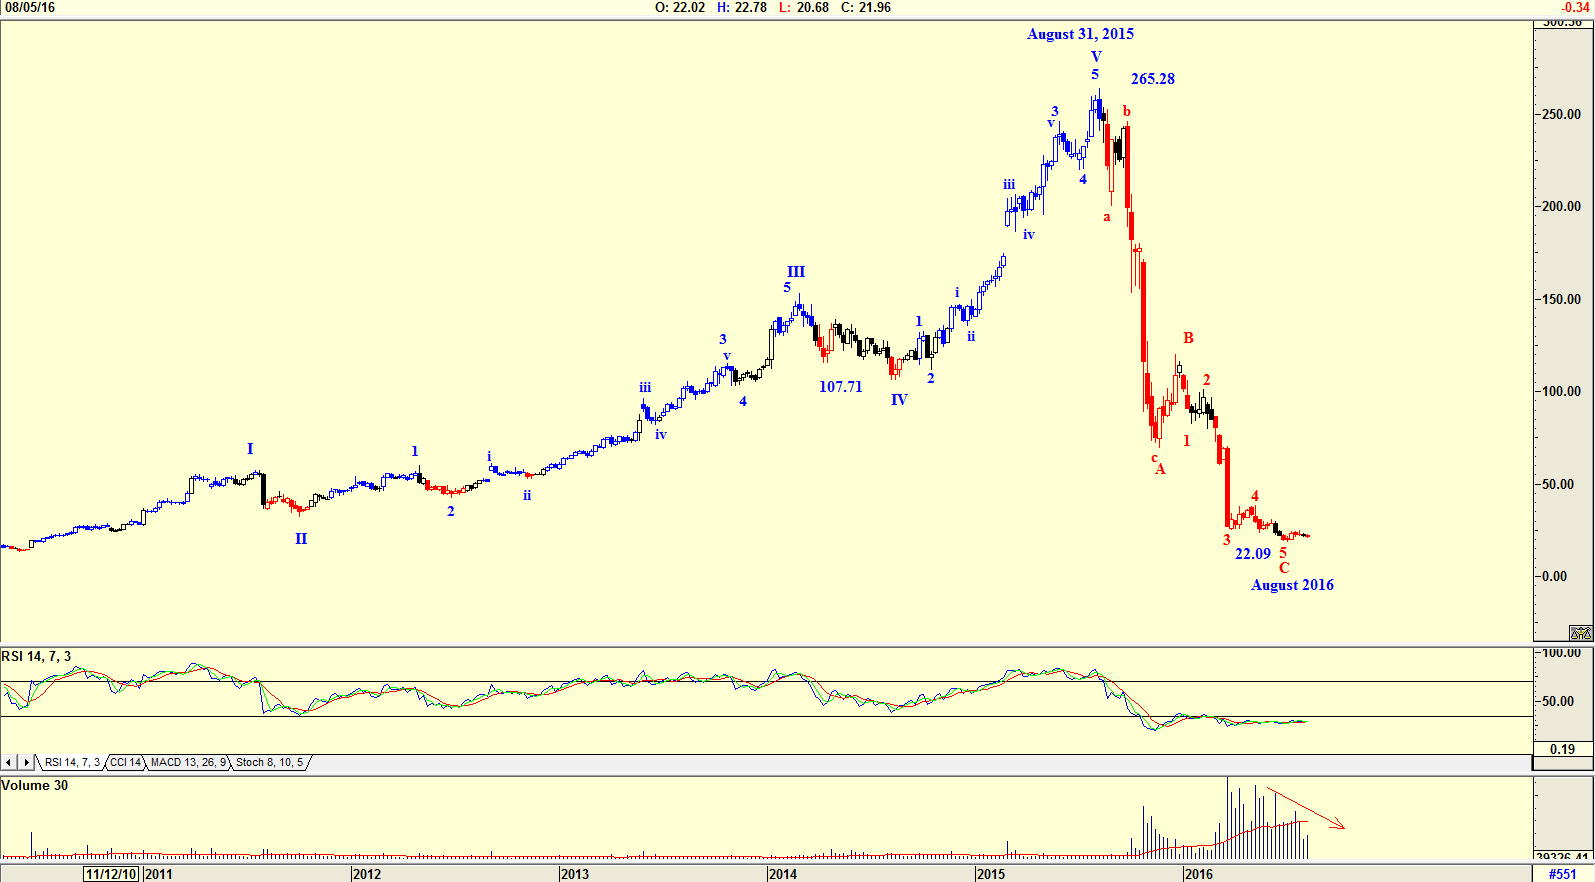
| Figure 2. Weekly chart suggesting a wave count bottom. |
| Graphic provided by: AdvancedGET. |
| |
| The chart in Figure 2 is a weekly chart confirming the Elliott wave count shown in Figure 1 and suggesting that the low of $22.09 of August 2016 could indeed be the low and that the share price could possibly start rising. Do note that volume fell as the price fell over the past few weeks, suggesting possible strength ahead. |

|
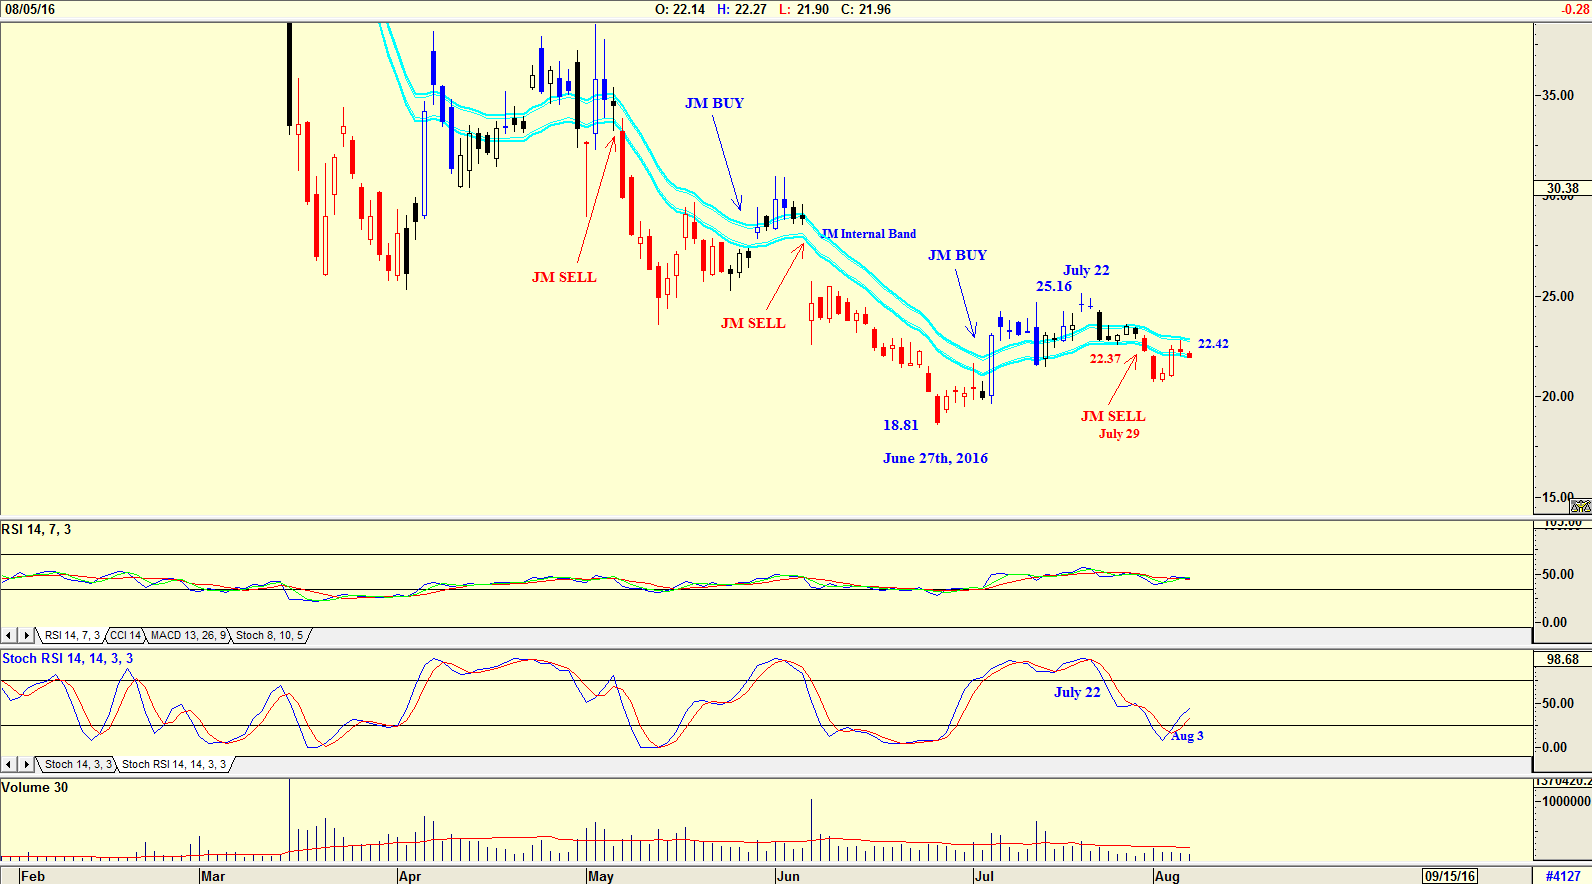
| Figure 3. Daily chart suggesting a possible buy signal. |
| Graphic provided by: AdvancedGET. |
| |
| The chart in Figure 3 is a daily chart showing that the share price reached a low of $18.81 on June 27th, 2016. Note how both the RSI indicator and the Stochastic RSI indicator gave a buy on June 27th. The Stochastic RSI suggested a sell on July 22nd when the price was $25.16. The JM Internal Band indicator suggested a SELL on July 29th when the share price was $22.37. The JM Internal Band is a 15 period simple moving average offset by 2% plus and 2% negative. A move above the upper band suggests a buy and below the lower band a sell. With the Stochastic RSI suggesting a buy on August 3rd with the share price at $22.42, do you buy the share, placing your trust in the company? The company has had to delay and totally redo its financial reporting. Pearson has been removed as CEO and Bill Ackman joined the board. Bill Ackman is a activist shareholder and makes his living tilting his spear at companies to agitate for change. With the share price of Valeant falling over 90%, many investors are questioning whether Bill Ackman is the shrewd investor his reputation has led one to believe. In his first few months as a company insider, he has secured backing from J.P. Morgan Chase and other banks to avert defaults on Valeant's bank debts. With the share price starting to rise, taking a bite of Valeant shares and placing one's trust in Bill Ackman could be a winner. Investors however, being more cautious, should wait for the JM Internal Band buy. |
Has been a technical analyst since 1969, and has worked as a futures and options trader with First Financial Futures in Johannesburg, South Africa.
| Address: | 3256 West 24th Ave |
| Vancouver, BC | |
| Phone # for sales: | 6042634214 |
| E-mail address: | petroosp@gmail.com |
Click here for more information about our publications!
PRINT THIS ARTICLE

Request Information From Our Sponsors
- StockCharts.com, Inc.
- Candle Patterns
- Candlestick Charting Explained
- Intermarket Technical Analysis
- John Murphy on Chart Analysis
- John Murphy's Chart Pattern Recognition
- John Murphy's Market Message
- MurphyExplainsMarketAnalysis-Intermarket Analysis
- MurphyExplainsMarketAnalysis-Visual Analysis
- StockCharts.com
- Technical Analysis of the Financial Markets
- The Visual Investor
- VectorVest, Inc.
- Executive Premier Workshop
- One-Day Options Course
- OptionsPro
- Retirement Income Workshop
- Sure-Fire Trading Systems (VectorVest, Inc.)
- Trading as a Business Workshop
- VectorVest 7 EOD
- VectorVest 7 RealTime/IntraDay
- VectorVest AutoTester
- VectorVest Educational Services
- VectorVest OnLine
- VectorVest Options Analyzer
- VectorVest ProGraphics v6.0
- VectorVest ProTrader 7
- VectorVest RealTime Derby Tool
- VectorVest Simulator
- VectorVest Variator
- VectorVest Watchdog
