HOT TOPICS LIST
- MACD
- Fibonacci
- RSI
- Gann
- ADXR
- Stochastics
- Volume
- Triangles
- Futures
- Cycles
- Volatility
- ZIGZAG
- MESA
- Retracement
- Aroon
INDICATORS LIST
LIST OF TOPICS
PRINT THIS ARTICLE
by Koos van der Merwe
I enjoy my Starbucks coffee every morning and must congratulate the CEO Howard Schultz on seducing me every day with an enjoyable drink. So why has the share price fallen from $64.05 in October 2015 to $58.05 at end of July?
Position: Accumulate
Koos van der Merwe
Has been a technical analyst since 1969, and has worked as a futures and options trader with First Financial Futures in Johannesburg, South Africa.
PRINT THIS ARTICLE
Starbucks
08/10/16 02:45:16 PMby Koos van der Merwe
I enjoy my Starbucks coffee every morning and must congratulate the CEO Howard Schultz on seducing me every day with an enjoyable drink. So why has the share price fallen from $64.05 in October 2015 to $58.05 at end of July?
Position: Accumulate
| Starbucks baristas say that the company is cutting hours and that consumers are paying the price; that the change came with no warning or explanation from executives. Some of the employees argue that the change came with no warning or explanation while others say that their schedules were cut in advance or that they were sent home during their shifts. These changes appear to have come at a time that Starbucks is adding new food and beverages to the menu. Of course, the question is why the change? Starbucks denies that the company has made any changes to it scheduling, but their staff says otherwise. So, what do the charts tell us? |

|
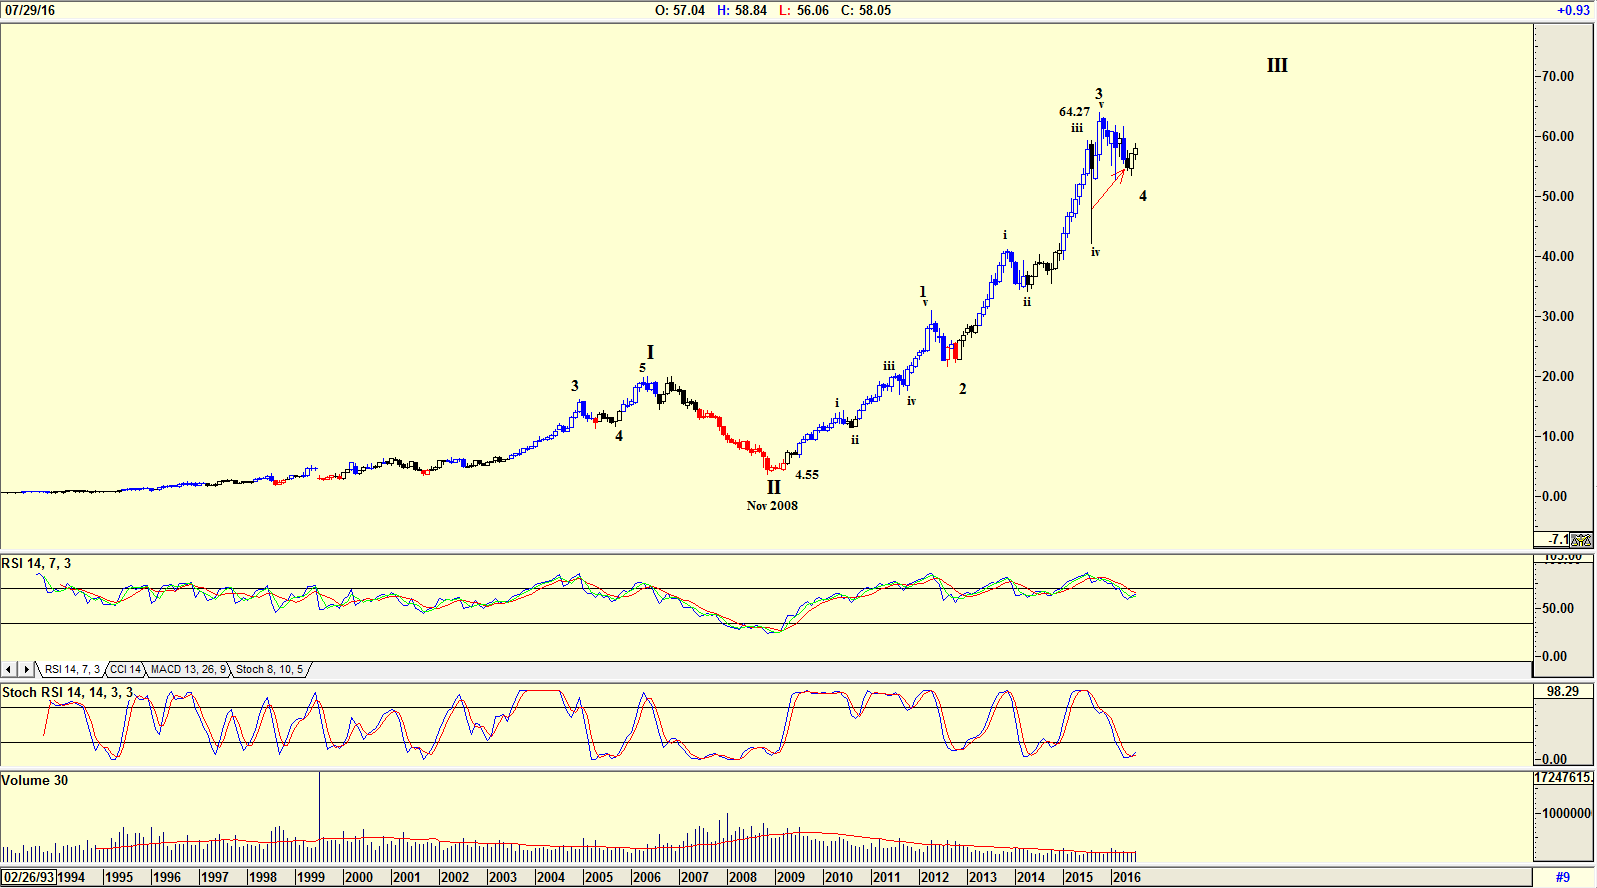
| Figure 1. Monthly chart with Elliott wave count. |
| Graphic provided by: AdvancedGET. |
| |
| The chart in Figure 1 is a monthly chart with an Elliott wave count suggesting that the share price is on its way "up up and away." At the moment the share price appears to be in a Wave 4 correction of WAVE III. With the Stochastic RSI indicator at oversold levels, something the RSI indicator is not suggesting, but looking back at the RSI indicator, one can see that the last time the indicator was at oversold levels was when the share price was $4.55 in November 2008. The share price could therefore be rising and possibly break above the $64.27 sometime in the future. |

|
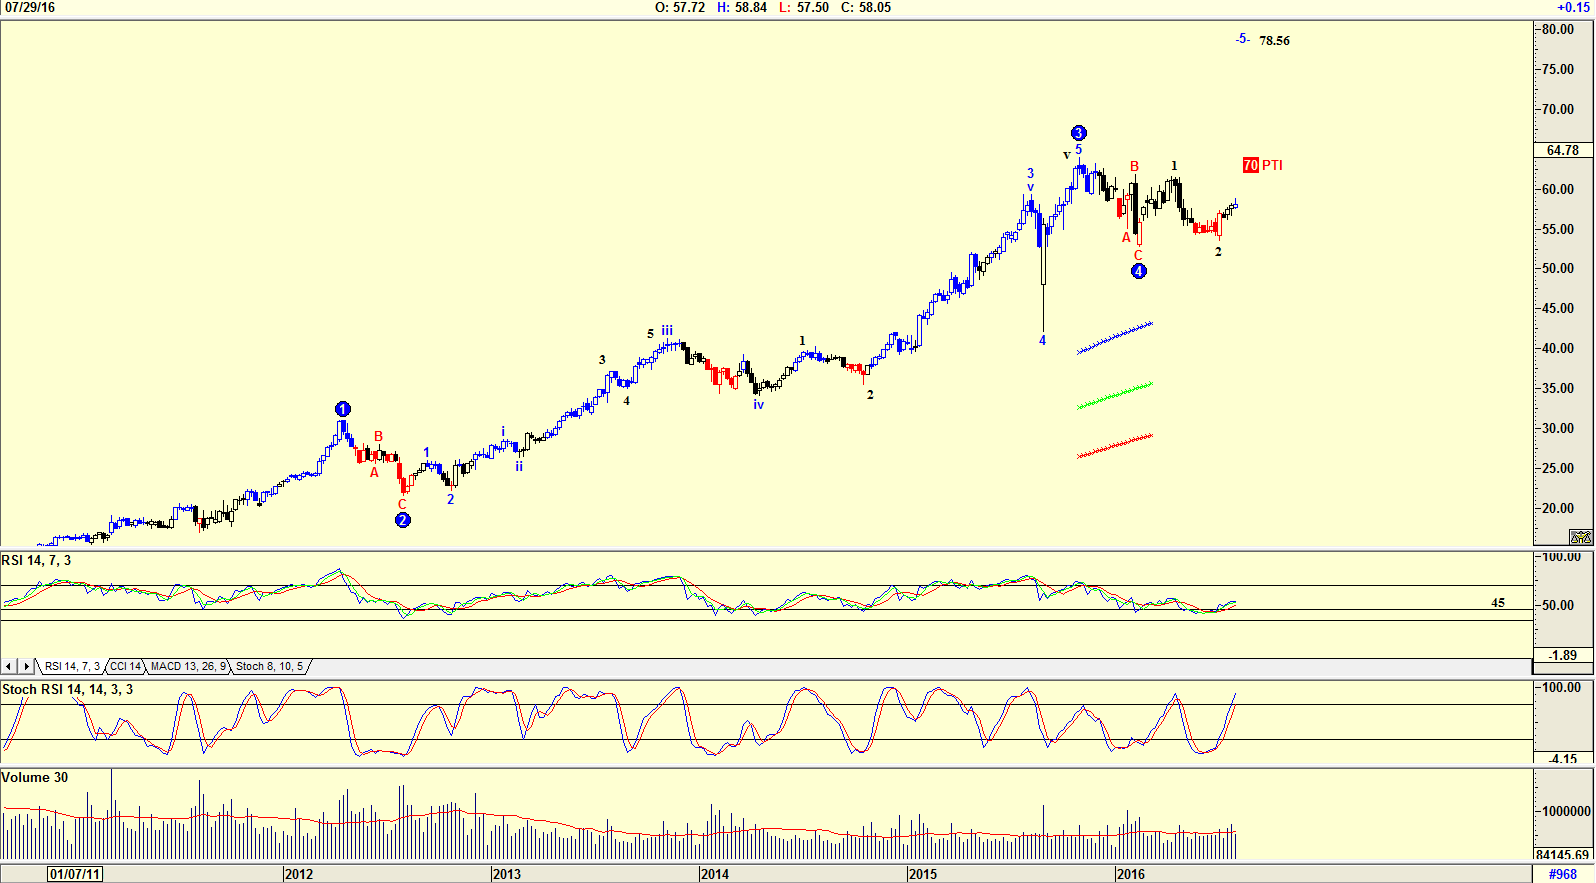
| Figure 2. Weekly chart with Elliott wave count. |
| Graphic provided by: AdvancedGET. |
| |
| The weekly chart of Starbucks in Figure 2 has an Elliott wave count suggesting that the share price has completed a WAVE 4 and should now start rising in a WAVE 5 with a target of $78.56. The PTI (Probability Indicator) is at 70, suggesting that this target is very possible. History has shown that the RSI indicator usually suggests a buy when it falls below, then breaks above the 45 level. The Stochastic RSI indicator, although at oversold levels, has not given a sell signal. |

|
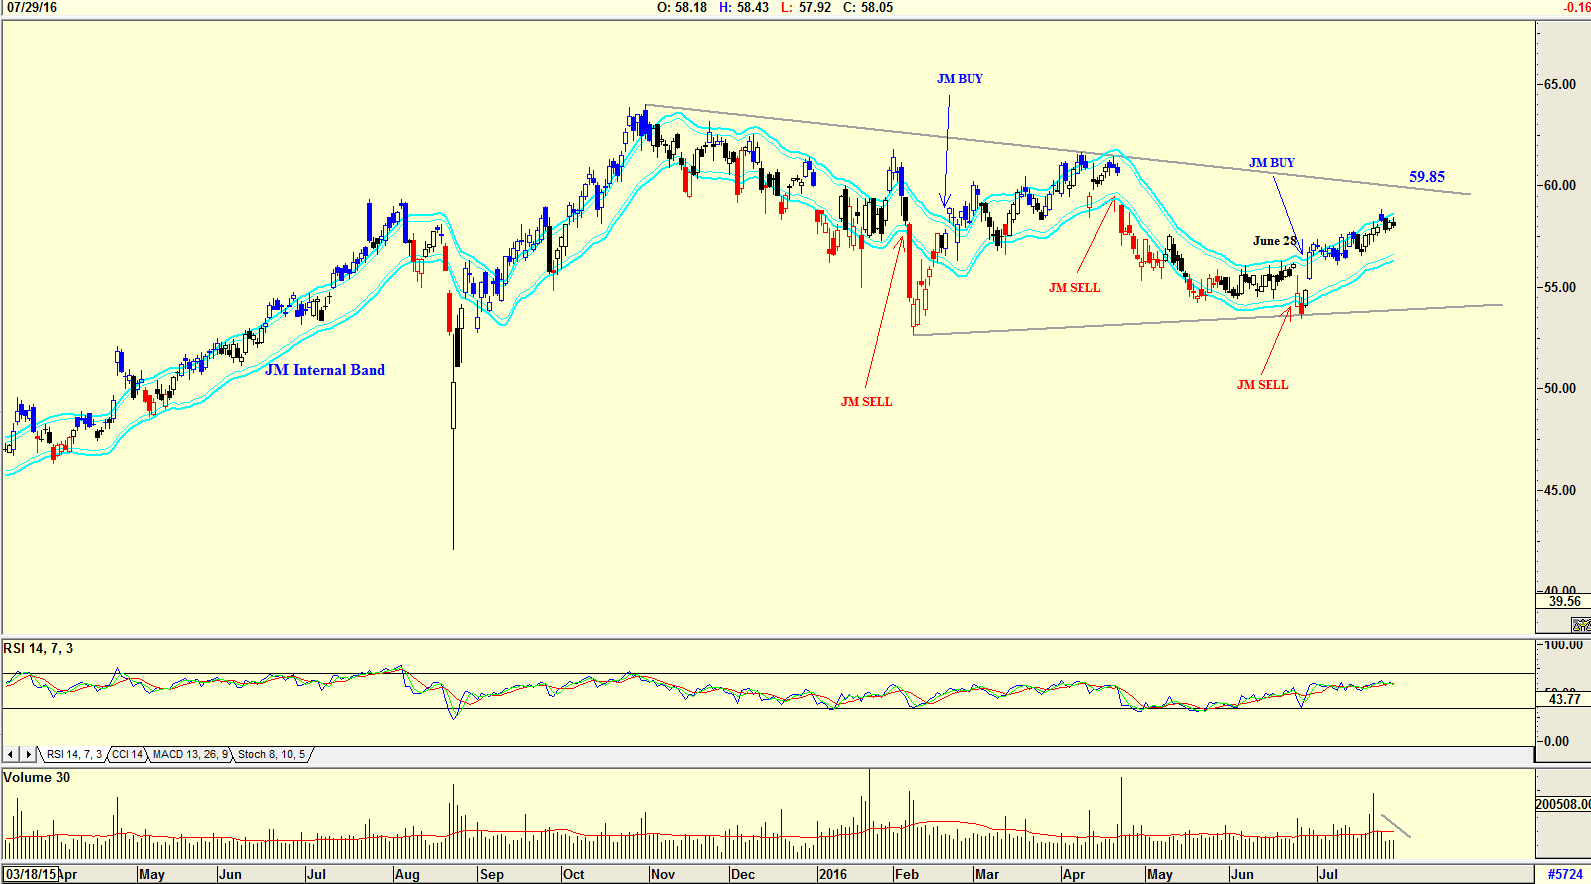
| Figure 3. Daily chart shoing the JM Internal Band indicator. |
| Graphic provided by: AdvancedGET. |
| |
| The chart in Figure 3 is a daily chart with the JM Internal Band indicator. The JM Internal Band is a 15 period simple moving average offset by 2% positive and 2% negative. A move above the upper band suggests a buy and below the lower band a sell. The share price gave a JM Buy on June 28 and is still positive. Volume fell as the share price fell recently, suggesting strength. Finally, do note the wedge formation that has formed suggesting that the share price should rise to the upper band at $59.85 if not higher. Studying the Starbucks charts, and especially putting trust in Howard Schultz, I would be a buyer of Starbucks shares for a long term hold. Howard Schultz pulled Starbucks out of calamity once before. I doubt he will allow the company to sink into calamity once again. There is definitely something up his sleeve. |
Has been a technical analyst since 1969, and has worked as a futures and options trader with First Financial Futures in Johannesburg, South Africa.
| Address: | 3256 West 24th Ave |
| Vancouver, BC | |
| Phone # for sales: | 6042634214 |
| E-mail address: | petroosp@gmail.com |
Click here for more information about our publications!
Comments
Date: 08/11/16Rank: 4Comment:

Request Information From Our Sponsors
- VectorVest, Inc.
- Executive Premier Workshop
- One-Day Options Course
- OptionsPro
- Retirement Income Workshop
- Sure-Fire Trading Systems (VectorVest, Inc.)
- Trading as a Business Workshop
- VectorVest 7 EOD
- VectorVest 7 RealTime/IntraDay
- VectorVest AutoTester
- VectorVest Educational Services
- VectorVest OnLine
- VectorVest Options Analyzer
- VectorVest ProGraphics v6.0
- VectorVest ProTrader 7
- VectorVest RealTime Derby Tool
- VectorVest Simulator
- VectorVest Variator
- VectorVest Watchdog
- StockCharts.com, Inc.
- Candle Patterns
- Candlestick Charting Explained
- Intermarket Technical Analysis
- John Murphy on Chart Analysis
- John Murphy's Chart Pattern Recognition
- John Murphy's Market Message
- MurphyExplainsMarketAnalysis-Intermarket Analysis
- MurphyExplainsMarketAnalysis-Visual Analysis
- StockCharts.com
- Technical Analysis of the Financial Markets
- The Visual Investor
