HOT TOPICS LIST
- MACD
- Fibonacci
- RSI
- Gann
- ADXR
- Stochastics
- Volume
- Triangles
- Futures
- Cycles
- Volatility
- ZIGZAG
- MESA
- Retracement
- Aroon
INDICATORS LIST
LIST OF TOPICS
PRINT THIS ARTICLE
by Koos van der Merwe
Netflix Inc.'s stock plunged after reporting results on July 19th.
Position: Accumulate
Koos van der Merwe
Has been a technical analyst since 1969, and has worked as a futures and options trader with First Financial Futures in Johannesburg, South Africa.
PRINT THIS ARTICLE
ELLIOTT WAVE
Netflix
08/03/16 04:22:30 PMby Koos van der Merwe
Netflix Inc.'s stock plunged after reporting results on July 19th.
Position: Accumulate
| The stock price plunge is the second biggest one day decline in Netflix's history, wiping close to $6 billion in market value. The stock price fell $13.96 (14%) to its lowest price since February 8th. Earnings beat analysts' expectations, but subscribers during the quarter were below expectations. With increasing competition developing, what are Netflix's hopes for the future? Will the company keep losing subscribers, or will they come up with a new strategy that will lead to the share price rising? Over the past few months they have increased their monthly subscription, probably the reason for the earnings beat, but a concern that the price increase was to cover loss of income as subscribers left. |

|
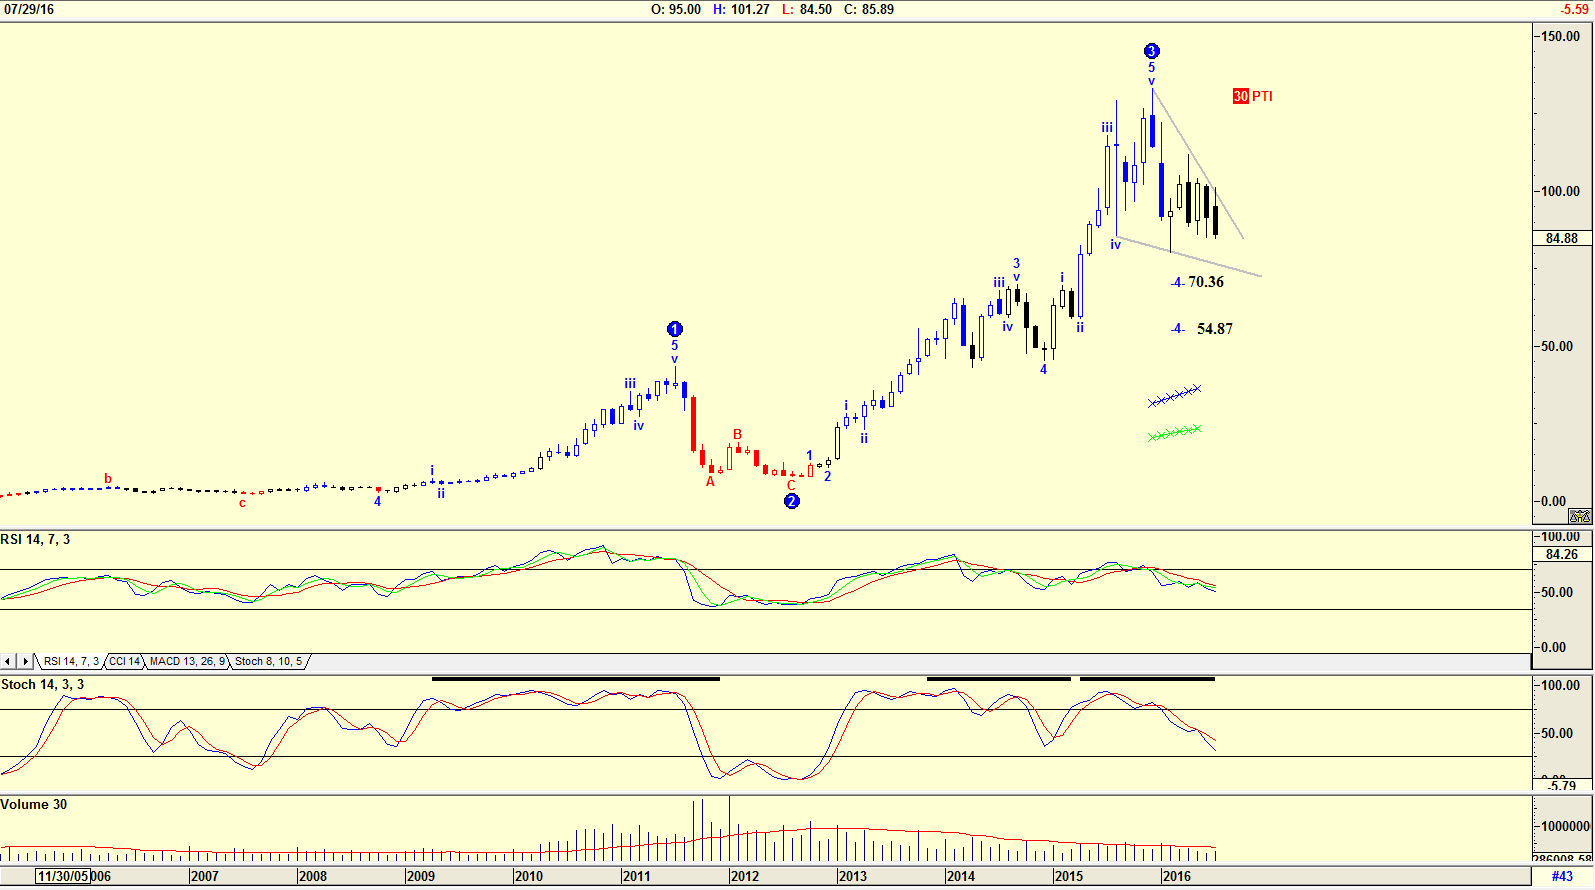
| Figure 1. Monthly chart of Netflix with Elliott wave count. |
| Graphic provided by: AdvancedGET. |
| |
| The chart in Figure 1 is a monthly chart with an Elliott wave count suggesting that the share price is correcting in a WAVE 4 with a target of either $70.36 or $54.87. The PTI (Probability Index) however is only 30, below the low of 32. This suggests that the forecast will probably be incorrect. When the PTI is below 32, the Elliott wave count will probably change sometime in the future. One should never forget that with unemotional computer trading becoming more prevalent, an Elliott wave count can change a little way down the road. Do note the two indicators, the RSI and Stochastic, which are both falling, suggesting weakness. However, also note the volume which has also been falling. Falling volume as a share price falls is suggesting a price reversal. |

|
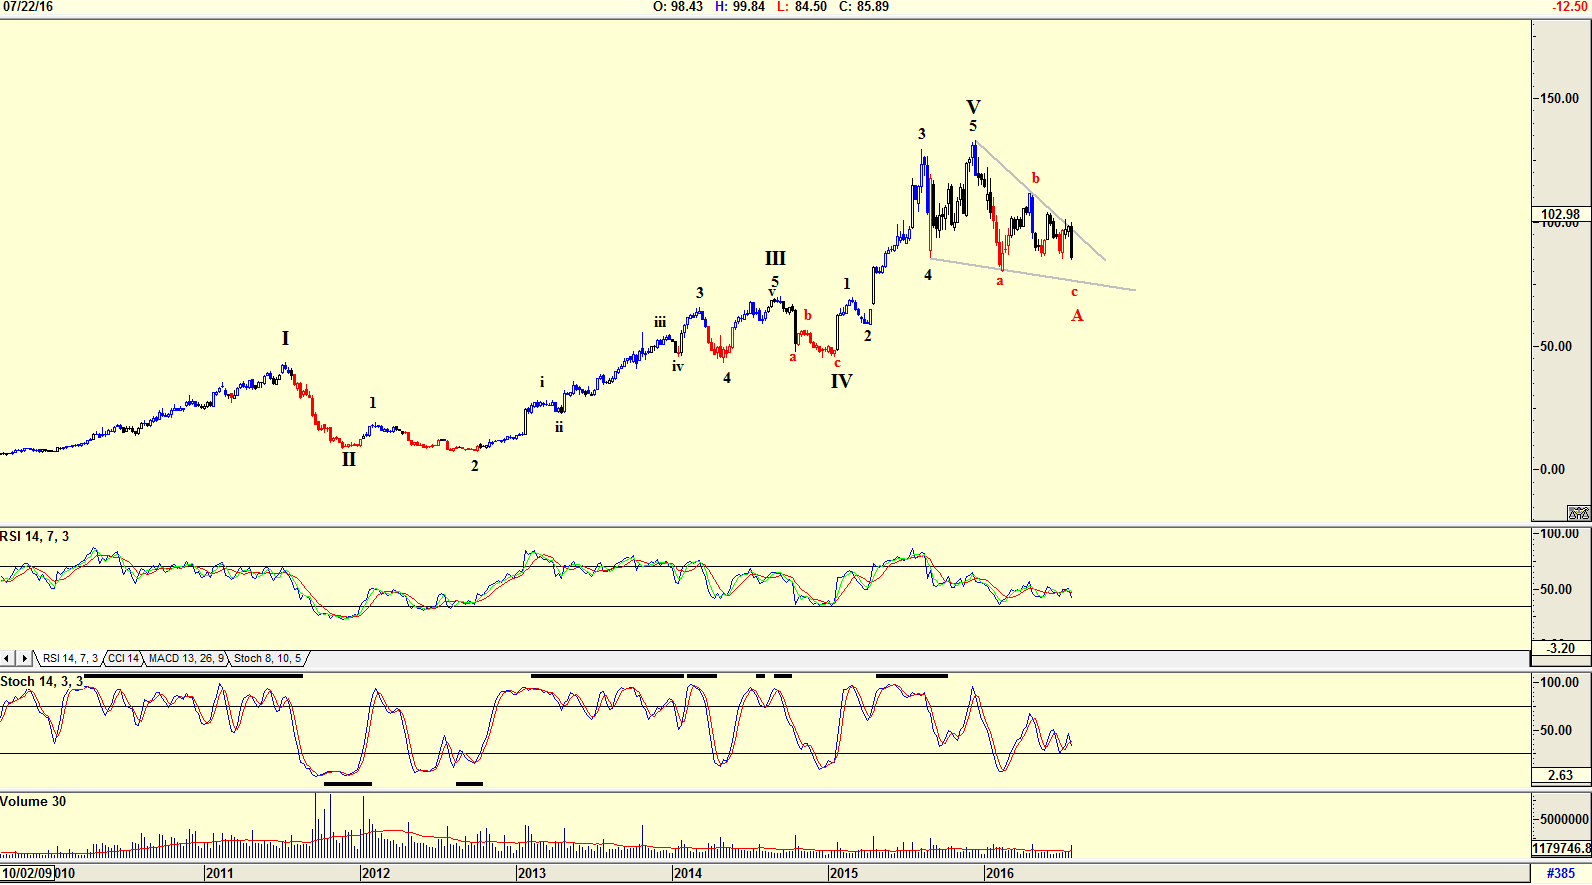
| Figure 2. Weekly chart of Netflix showing wedge pattern. |
| Graphic provided by: AdvancedGET. |
| |
| The weekly chart in Figure 2 has an Elliott wave count suggesting that the share price is in a WAVE A correction. The falling wedge pattern that has formed on the chart is suggesting a reversal when the share price tests the support line a 'c'. This is confirmed by the two indicators which have both suggested a buy. The correction up could either be a WAVE B or a WAVE I, the start of a new bull trend. Time will tell. |

|
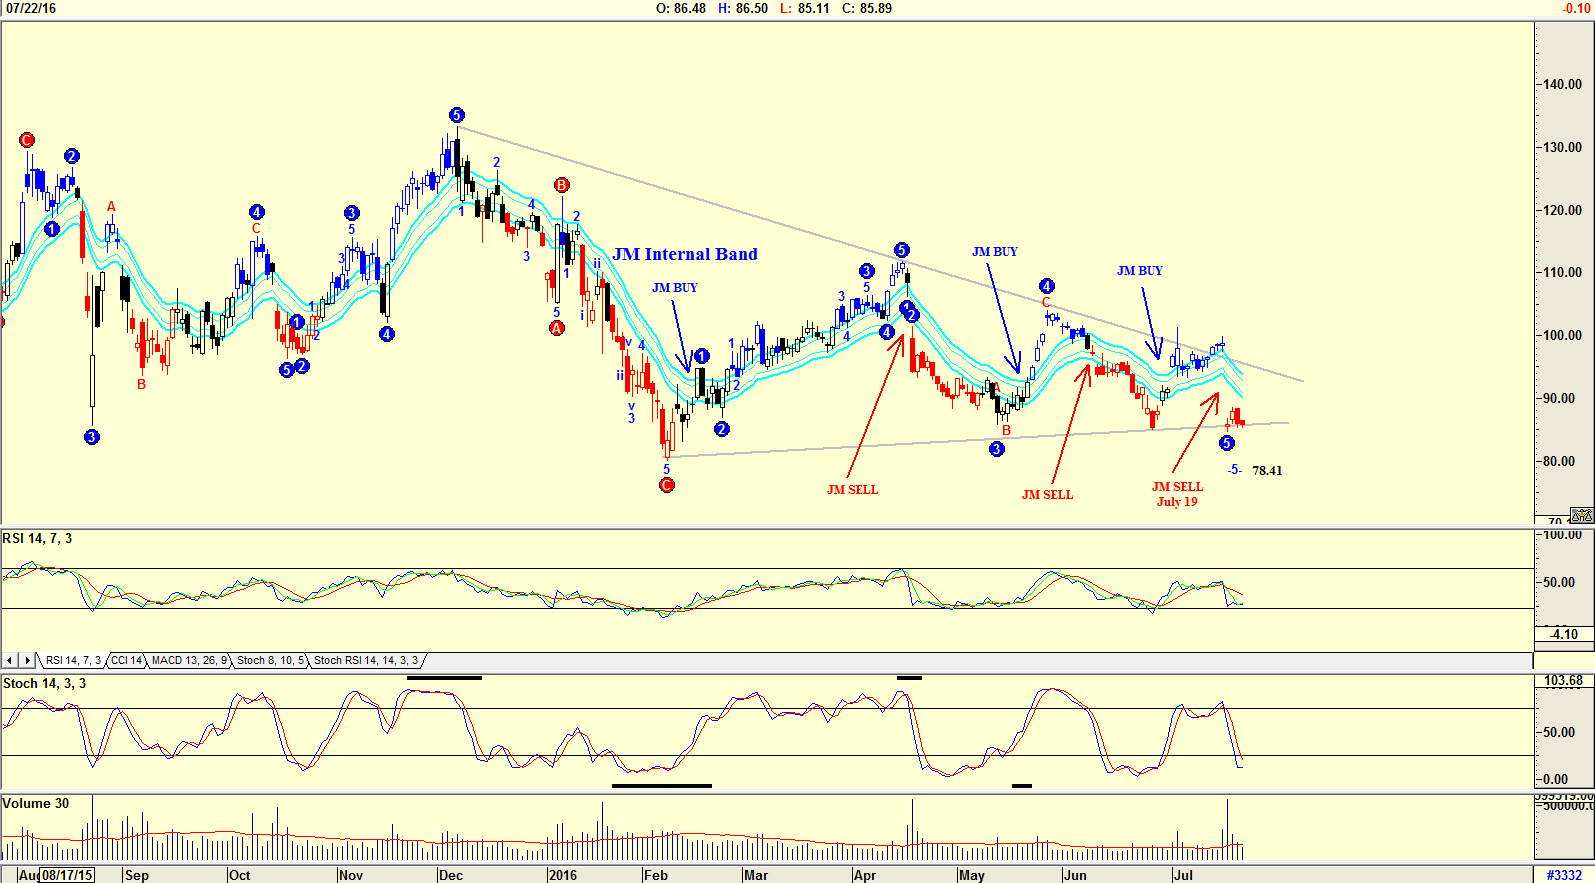
| Figure 3. Daily chart of Netflix. |
| Graphic provided by: AdvancedGET. |
| |
| The chart in Figure 3 shows an Elliott count within the WEDGE pattern. The count suggests that a WAVE 5 could be complete and that the share price could start rising. However, the possibility that the share price could fall to $78.41 before rising does exist. The RSI 14 Indicator is in buy mode, but the Stochastic indicator, although oversold, has not given a buy. Do note the JM Internal Band, where a sell was triggered as the share price broke below the lower band on July 19th, after the quarterly results were released. The JM Internal Band is a 15 period simple moving average offset by 2% positive and 2% negative. A move above the upper band suggests a buy and a move below the lower band, a sell. With the share price testing the lower band of the WEDGE, traders could consider buying the share. Investors, however, should wait for the price to rise above the upper JM Internal band. The fact that Netlix has increased its monthly fee is definitely a sign that the company is facing subscriber losses because of competition. The company is being placed under pressure, and unless they come up with something new and attractive, the share price for the future will be ordinary, and no longer a winner. |
Has been a technical analyst since 1969, and has worked as a futures and options trader with First Financial Futures in Johannesburg, South Africa.
| Address: | 3256 West 24th Ave |
| Vancouver, BC | |
| Phone # for sales: | 6042634214 |
| E-mail address: | petroosp@gmail.com |
Click here for more information about our publications!
PRINT THIS ARTICLE

|

Request Information From Our Sponsors
- StockCharts.com, Inc.
- Candle Patterns
- Candlestick Charting Explained
- Intermarket Technical Analysis
- John Murphy on Chart Analysis
- John Murphy's Chart Pattern Recognition
- John Murphy's Market Message
- MurphyExplainsMarketAnalysis-Intermarket Analysis
- MurphyExplainsMarketAnalysis-Visual Analysis
- StockCharts.com
- Technical Analysis of the Financial Markets
- The Visual Investor
- VectorVest, Inc.
- Executive Premier Workshop
- One-Day Options Course
- OptionsPro
- Retirement Income Workshop
- Sure-Fire Trading Systems (VectorVest, Inc.)
- Trading as a Business Workshop
- VectorVest 7 EOD
- VectorVest 7 RealTime/IntraDay
- VectorVest AutoTester
- VectorVest Educational Services
- VectorVest OnLine
- VectorVest Options Analyzer
- VectorVest ProGraphics v6.0
- VectorVest ProTrader 7
- VectorVest RealTime Derby Tool
- VectorVest Simulator
- VectorVest Variator
- VectorVest Watchdog
