HOT TOPICS LIST
- MACD
- Fibonacci
- RSI
- Gann
- ADXR
- Stochastics
- Volume
- Triangles
- Futures
- Cycles
- Volatility
- ZIGZAG
- MESA
- Retracement
- Aroon
INDICATORS LIST
LIST OF TOPICS
PRINT THIS ARTICLE
by Koos van der Merwe
Barclays Bank cut their target for Apple shares from $121 to $115 last week.
Position: Accumulate
Koos van der Merwe
Has been a technical analyst since 1969, and has worked as a futures and options trader with First Financial Futures in Johannesburg, South Africa.
PRINT THIS ARTICLE
ELLIOTT WAVE
What's Up With Apple?
07/21/16 02:44:15 PMby Koos van der Merwe
Barclays Bank cut their target for Apple shares from $121 to $115 last week.
Position: Accumulate
| So far this year, sales of Apple products have not been as successful as expected. Sales of the Apple watch were below expectations. Sales of the iPad were also below expectations. Now with rumors of an iPhone 7 that will be above expectations, with rumors of Apple TV, Apple motorcar, Apple who knows what, could buying Apple at the present price be a long term profitable hold or, is the downgrade by Barclays the way of Apple's future? |

|
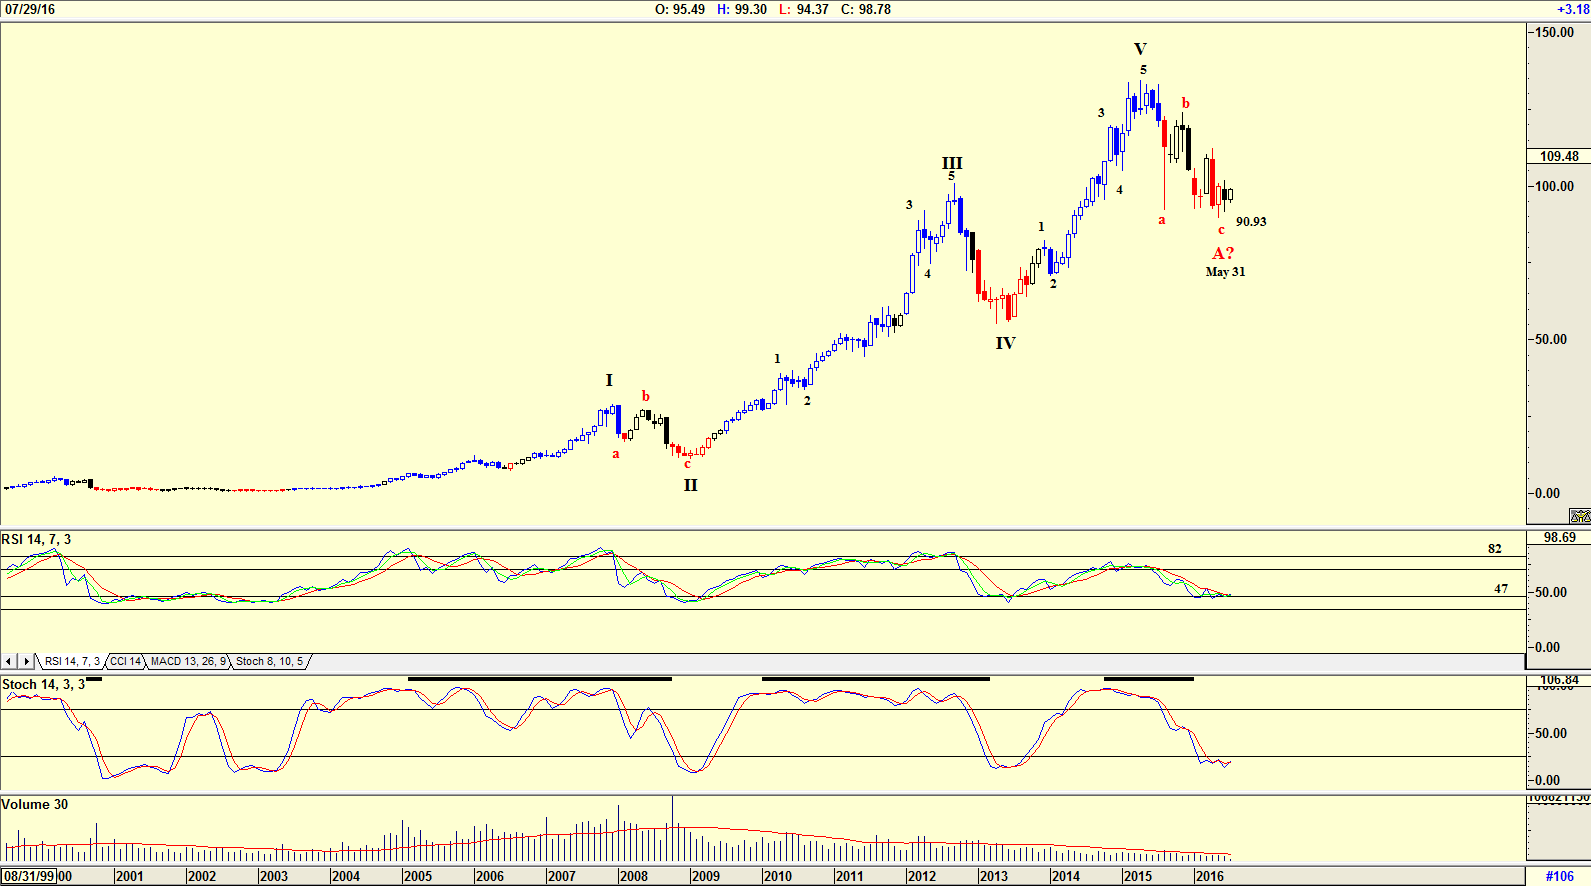
| Figure 1. Monthly chart of AAPL with Elliott wave count. |
| Graphic provided by: AdvancedGET. |
| |
| The chart in Figure 1 is a monthly chart of Apple with an Elliott wave count suggesting that the share price has completed an abc correction and could start rising in a new WAVE I or as the chart suggests, this could be a WAVE A bottom. The RSI indicator has in the past suggested a buy when it rises above the 47 level. The Stochastic indicator is also oversold and could suggest a buy in the near future. Volume, however, is very much below average, and with the share price dropping on low volume, strength is suggested for the future. |

|
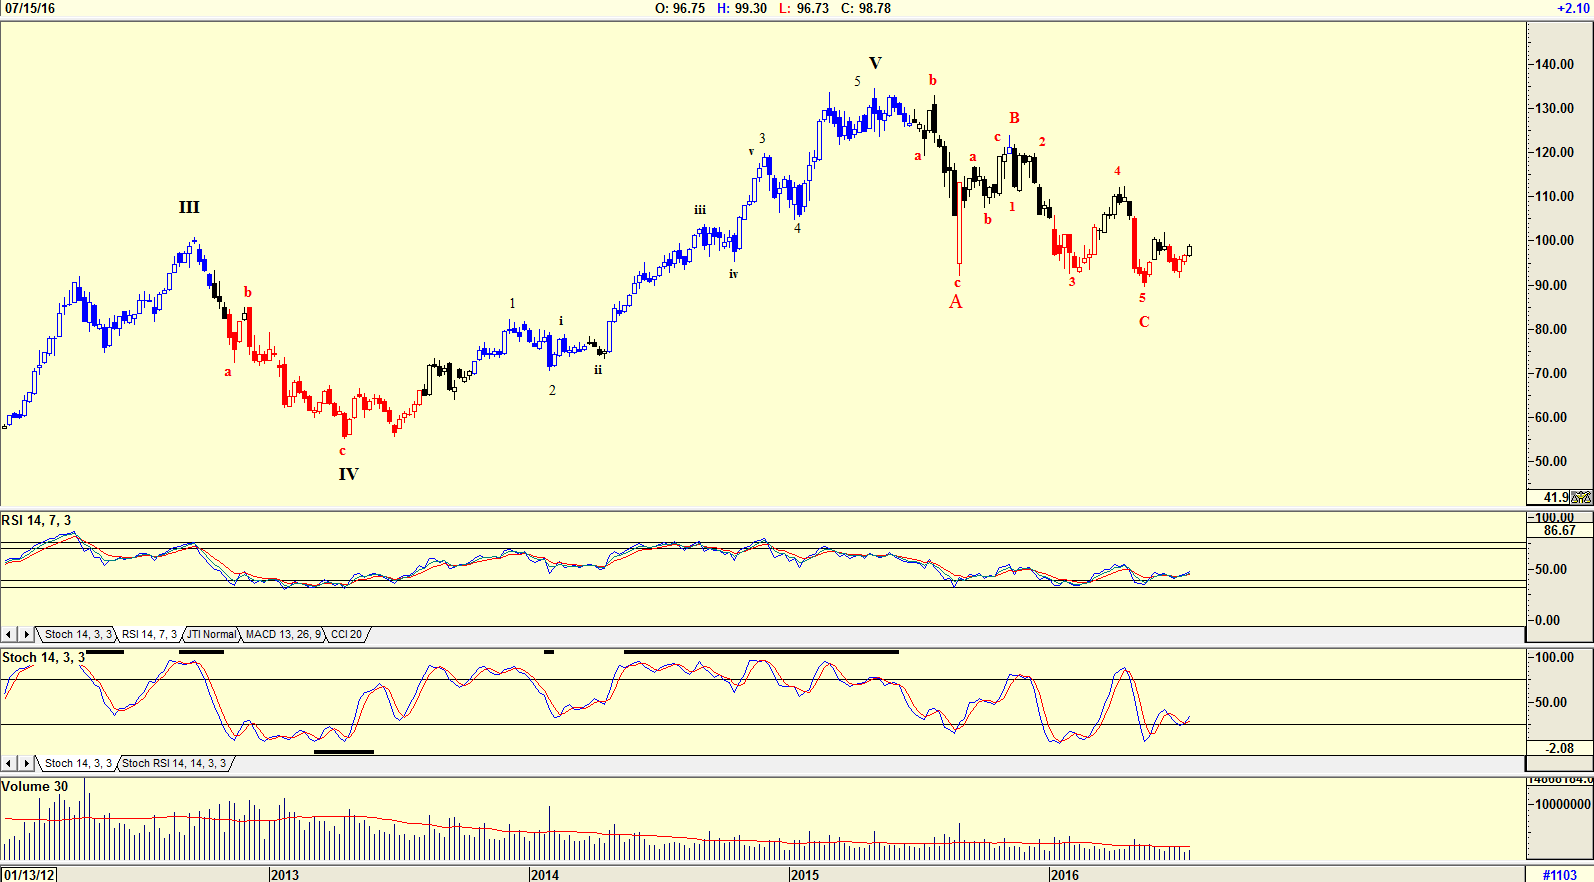
| Figure 2. Weekly chart of AAPL with Elliott wave count. |
| Graphic provided by: AdvancedGET. |
| |
| The weekly chart in Figure 2 confirms the monthly Elliott wave count, suggesting that a WAVE C correction has been completed, and that the share price could now start rising. This is confirmed by both the RSI indicator and the Stochastic indicator. Volume, however, is still below average as the share price rose over the past two weeks, a sign of weakness. |

|
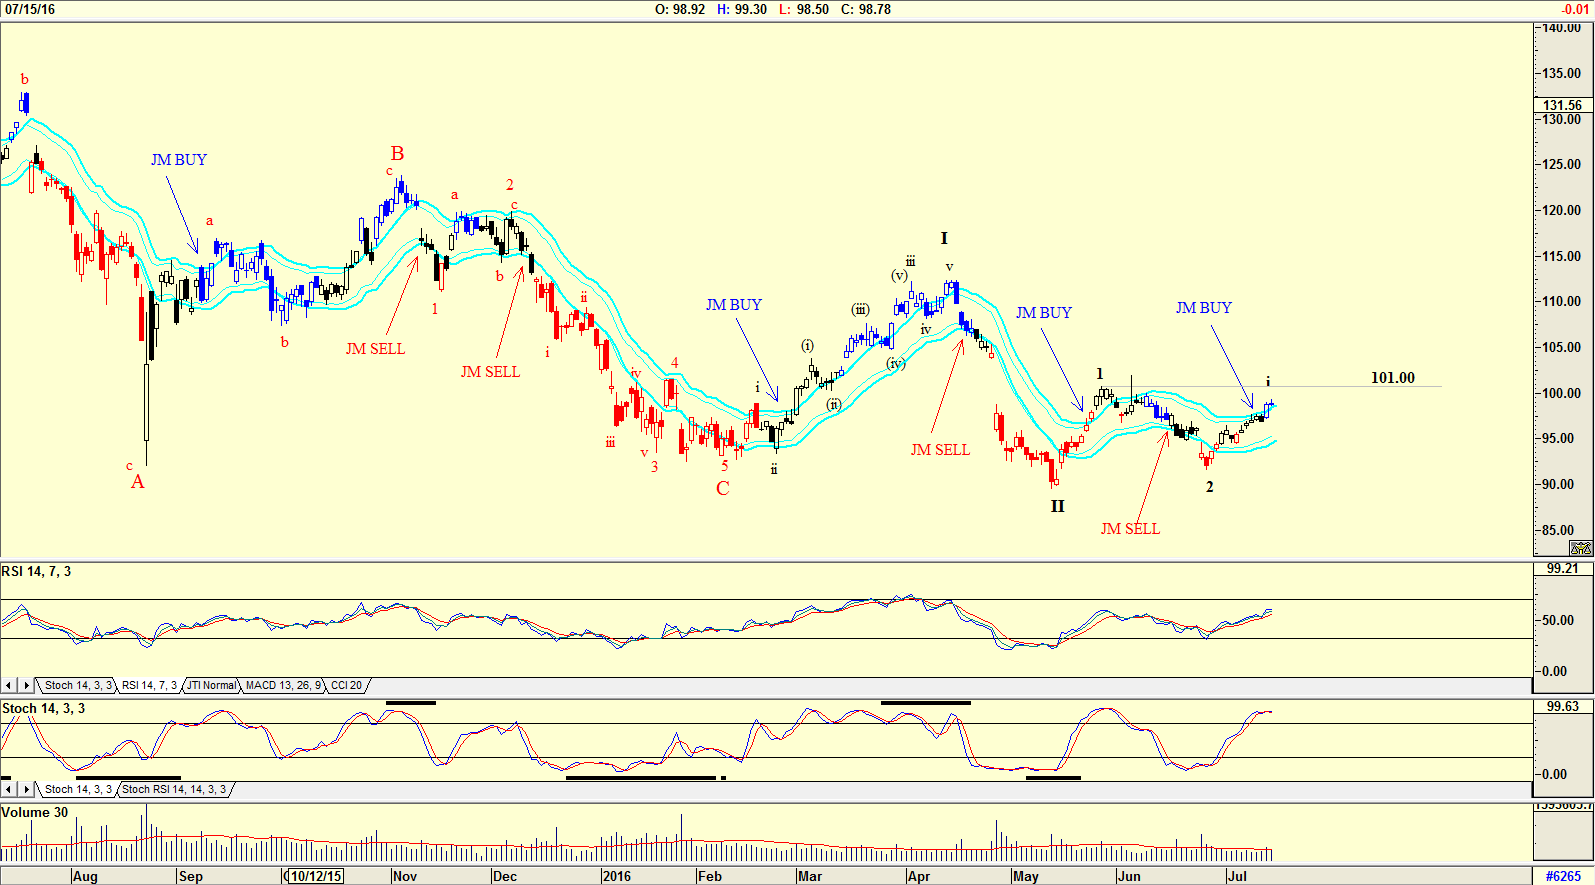
| Figure 3. Daily chart of AAPL with Elliott wave count. |
| Graphic provided by: AdvancedGET. |
| |
| The chart in Figure 3 is a daily chart with an Elliott wave count suggesting that the share price could be in a wave I of Wave 3 of WAVE III. The RSI indicator is suggesting strength but the Stochastic indicator is at overbought levels. Once again, volume is below average. The chart also shows that a buy signal was given by the JM Internal Band indicator. The JM Internal Band is a simple 15-period moving average offset by 2% positive and 2% negative. A move above the upper band suggests a buy and below the lower band a sell. A conservative buyer would probably wait for a move above the $101 level before buying. This is the high of Wave 1 as shown on the chart. Yes, with computer trading becoming more and more prevalent, Elliott wave counts can change at the drop of a hat a little way down the road. With Barclays Bank cutting its target, caution should prevail for the future, however, with Apple, one never knows. Their next product could be a winner that will see the share price soar. Buying the share at current levels, therefore, for a long term hold irrespective of how the market moves, could be the way to go. |
Has been a technical analyst since 1969, and has worked as a futures and options trader with First Financial Futures in Johannesburg, South Africa.
| Address: | 3256 West 24th Ave |
| Vancouver, BC | |
| Phone # for sales: | 6042634214 |
| E-mail address: | petroosp@gmail.com |
Click here for more information about our publications!
PRINT THIS ARTICLE

Request Information From Our Sponsors
- StockCharts.com, Inc.
- Candle Patterns
- Candlestick Charting Explained
- Intermarket Technical Analysis
- John Murphy on Chart Analysis
- John Murphy's Chart Pattern Recognition
- John Murphy's Market Message
- MurphyExplainsMarketAnalysis-Intermarket Analysis
- MurphyExplainsMarketAnalysis-Visual Analysis
- StockCharts.com
- Technical Analysis of the Financial Markets
- The Visual Investor
- VectorVest, Inc.
- Executive Premier Workshop
- One-Day Options Course
- OptionsPro
- Retirement Income Workshop
- Sure-Fire Trading Systems (VectorVest, Inc.)
- Trading as a Business Workshop
- VectorVest 7 EOD
- VectorVest 7 RealTime/IntraDay
- VectorVest AutoTester
- VectorVest Educational Services
- VectorVest OnLine
- VectorVest Options Analyzer
- VectorVest ProGraphics v6.0
- VectorVest ProTrader 7
- VectorVest RealTime Derby Tool
- VectorVest Simulator
- VectorVest Variator
- VectorVest Watchdog
