HOT TOPICS LIST
- MACD
- Fibonacci
- RSI
- Gann
- ADXR
- Stochastics
- Volume
- Triangles
- Futures
- Cycles
- Volatility
- ZIGZAG
- MESA
- Retracement
- Aroon
INDICATORS LIST
LIST OF TOPICS
PRINT THIS ARTICLE
by Koos van der Merwe
The American presidential election; the Brexit vote for Britain to leave the European Union; the gun crises in the USA. Uncertainty, uncertainty, uncertainty. What next?
Position: Sell
Koos van der Merwe
Has been a technical analyst since 1969, and has worked as a futures and options trader with First Financial Futures in Johannesburg, South Africa.
PRINT THIS ARTICLE
TECHNICAL ANALYSIS
Uncertainty
07/20/16 03:46:06 PMby Koos van der Merwe
The American presidential election; the Brexit vote for Britain to leave the European Union; the gun crises in the USA. Uncertainty, uncertainty, uncertainty. What next?
Position: Sell
| The past week few weeks have been tumultuous. With the declaration by Britain that it intends to leave the European Union, and with the resignation of David Cameron, the Prime Minister, the Dow Jones fell 883.55 points in two days. Since then, it has recovered those losses and risen to new highs. What now for the months before the US presidential election? Is the Dow going higher? Is Janet Yellen, Chair of the Board of Governors of the Federal Reserve System, going to announce an increase in interest rates before the presidential election takes place? Is the violence presently happening in the USA contributing to the financial uncertainy; the murder by terrorists of 49 people in Orlando; the Dallas sniper attack, a payback for the fatal recent police shootings of black men in Minnesota and Louisiana. The world looks to America for guidance, but with both presidential candidates creating voter uncertainty — Hilary Clinton's controversial emails and Donald Trump's off the cuff speeches, what lies in the future for the financial markets? |

|
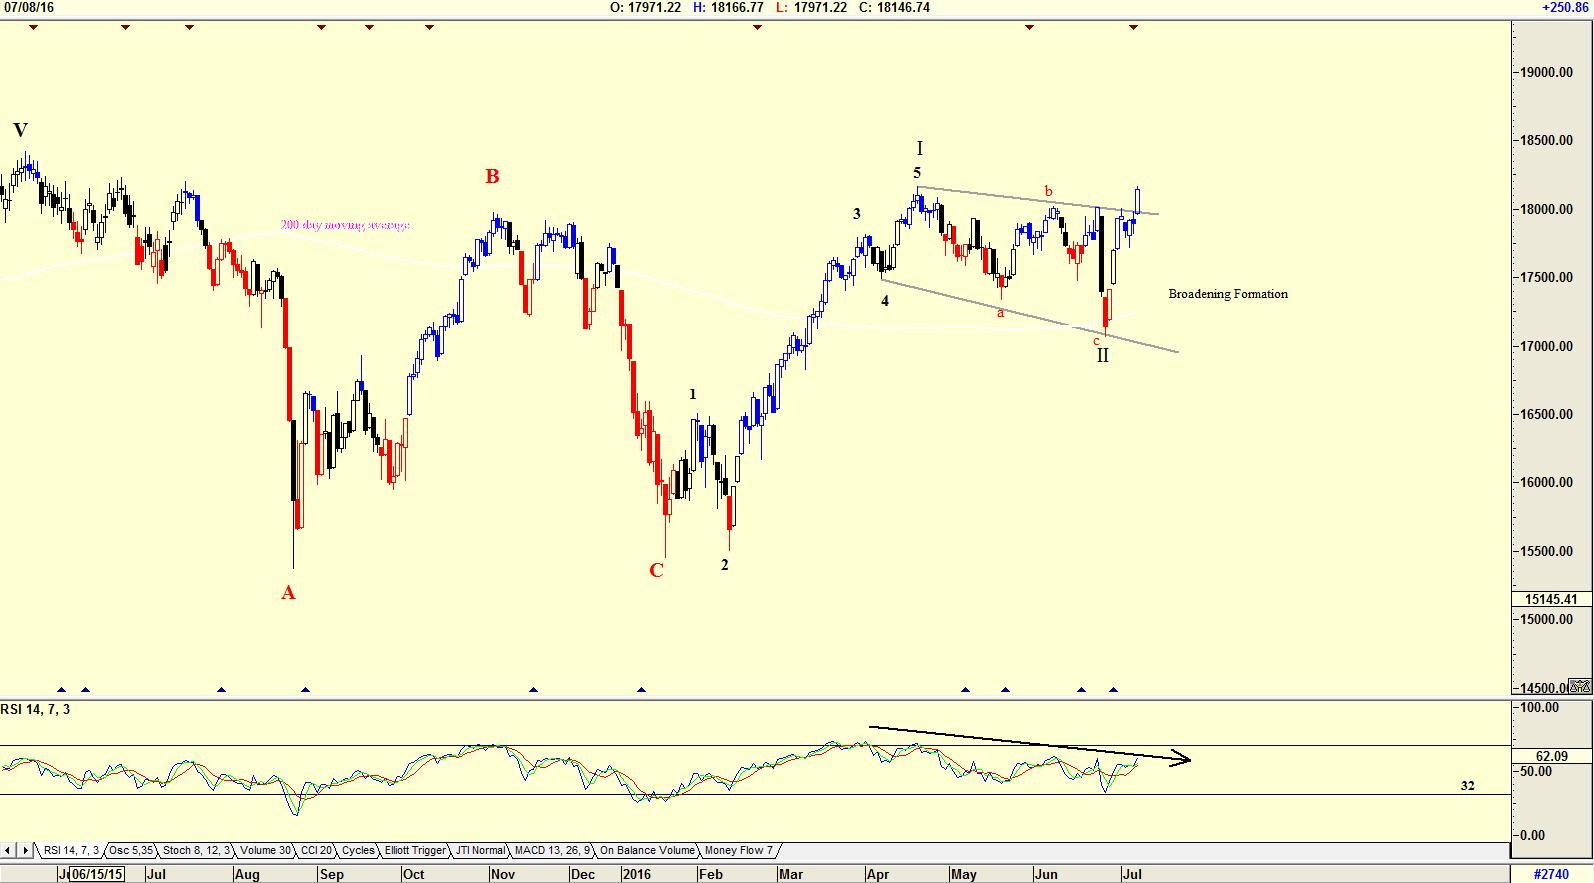
| Figure 1. The Dow Jones. |
| Graphic provided by: AdvancedGET. |
| |
| The chart in Figure 1 is a chart of the Dow Jones showing a broadening formation that has developed, not a very strong one, but something to keep in mind. A broadening formation is where instead of a flag pattern, that is where two trend lines are parallel to each other, the trend lines widen as they progress. The chart shows how the Dow bounced off the 200-day moving average, in what could well be the start of a WAVE III of a new bull market. However, the RSI also suggests uncertainty, because it has trended down and did not fall below the 32 horizontal line and then rise above it to suggest a buy. So, is the rise above the upper resistance line an error, or will the Dow continue to rise in a Wave III? |

|
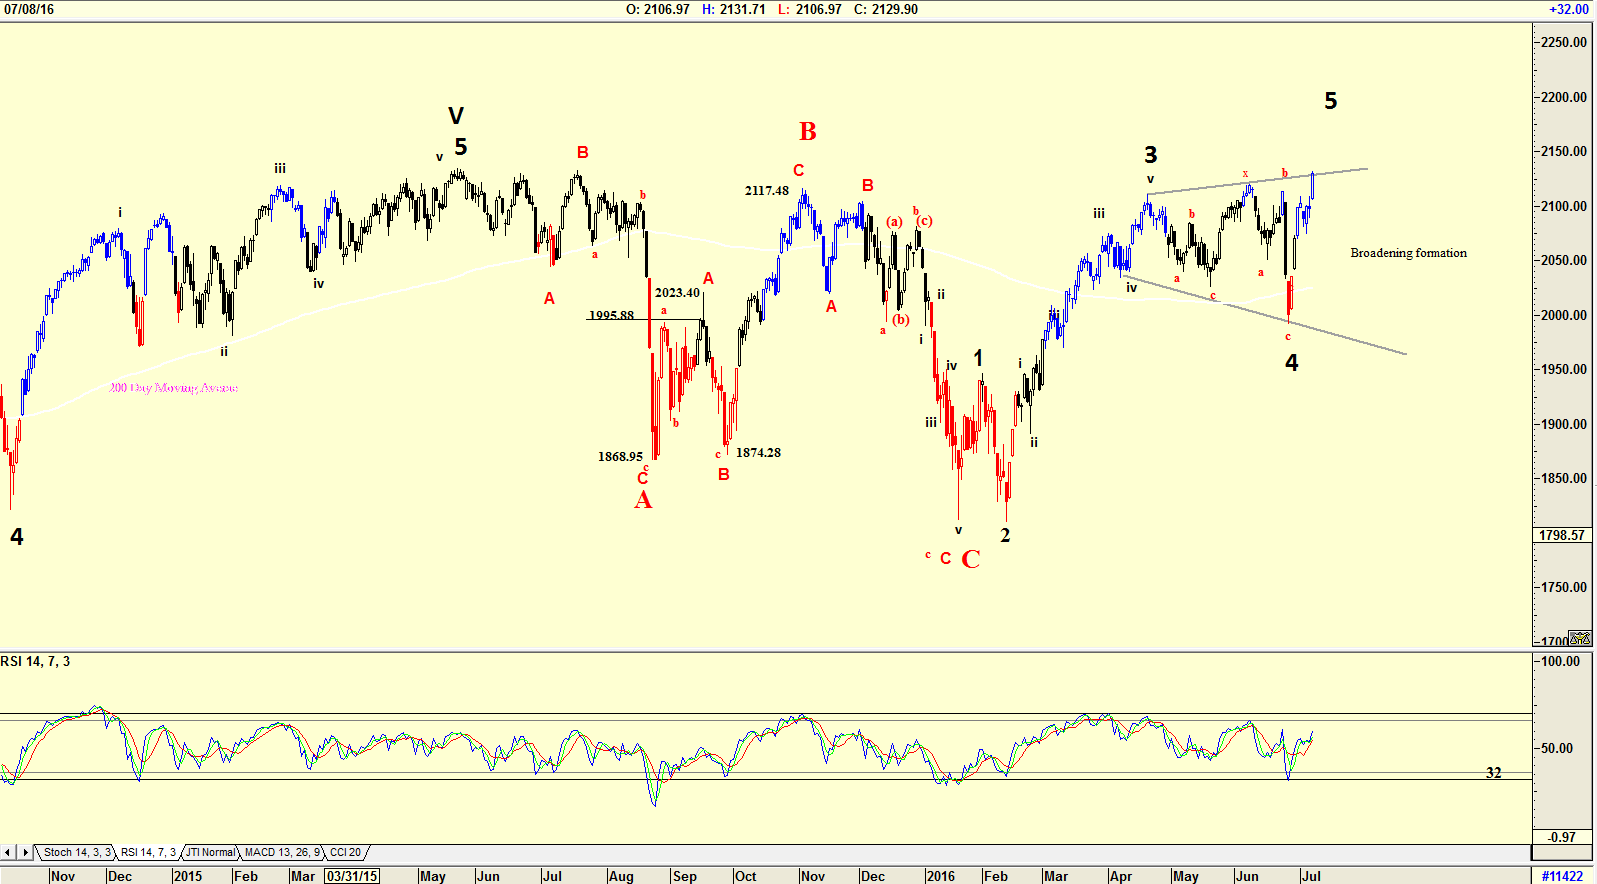
| Figure 2. The S&P 500 index. |
| Graphic provided by: AdvancedGET. |
| |
| The chart in Figure 2 is a daily chart of the S&P 500 index, and shows the broadening formation a great deal clearer than the chart in Figure 1. However, in this chart the RSI index has fallen to the 32 level, and has given a buy signal, suggesting that a WAVE 5, and not a WAVE III, as suggested by the DOW in Figure 1 is occurring. This means that the WAVE 5 could be a failure, and top out at present levels. |

|
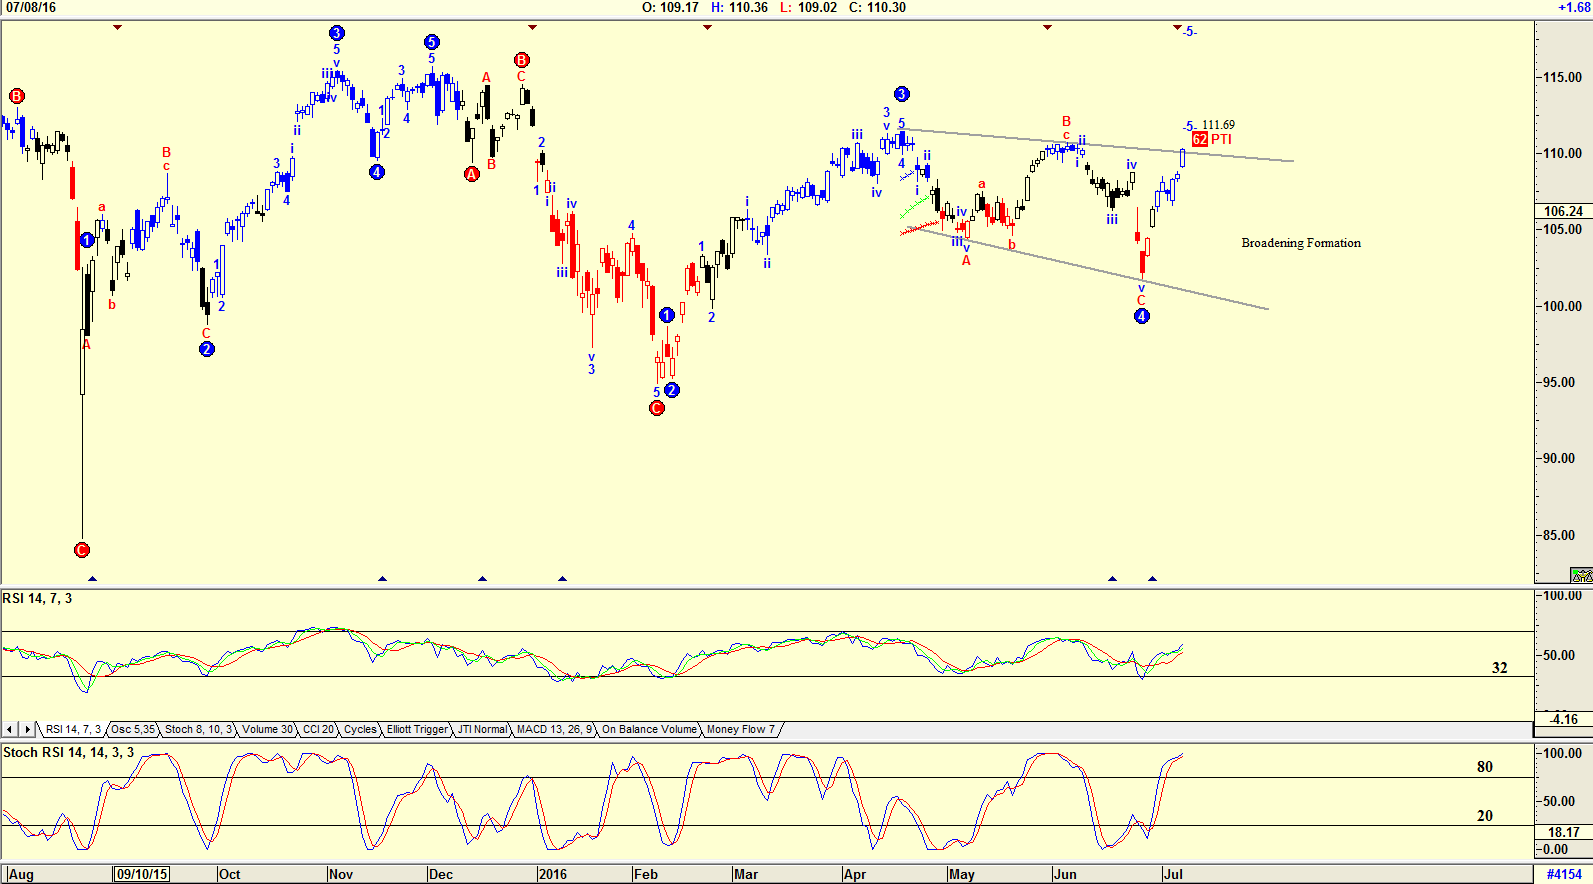
| Figure 3. The Nasdaq. |
| Graphic provided by: AdvancedGET. |
| |
| The chart in Figure 3 is a daily chart of the Nasdaq 100 index with an Elliott wave count suggesting that the index could be in a WAVE 5. Once again the broadening formation is there, suggesting uncertainty. The RSI index has given a buy, as has the Stochastic RSI Indicator. However, the Stochastic RSI Indicator does seem to be topping out. Do note the PTI at 62. The PTI is the probability index, suggesting that there is a 62% probability that the index could rise to wave 5 as shown on the chart. |

|
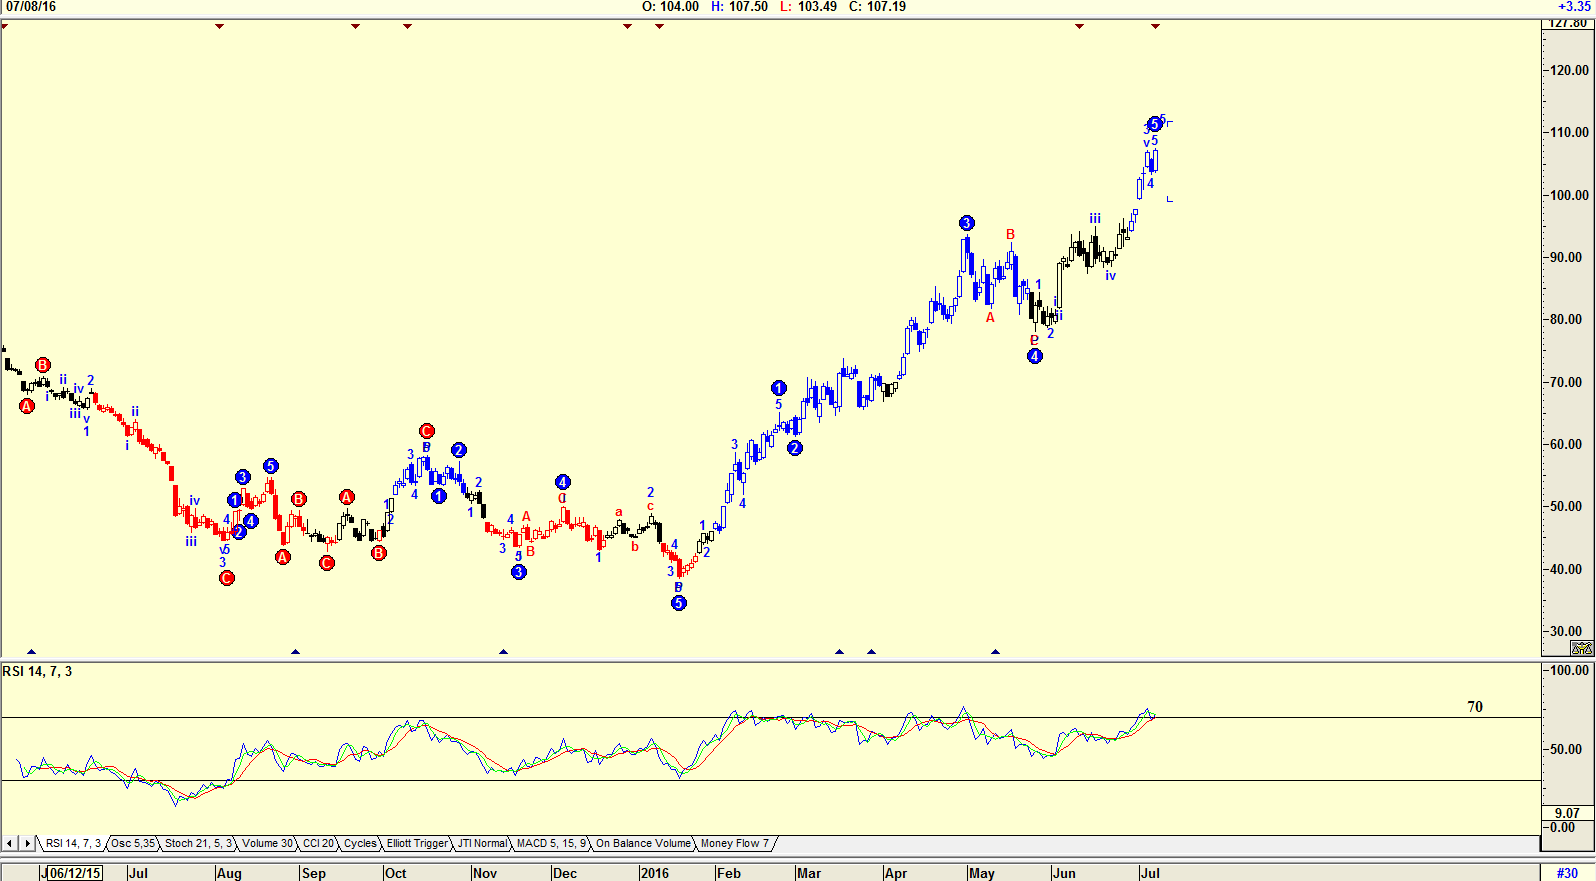
| Figure 4. The Gold and Silver index. |
| Graphic provided by: AdvancedGET. |
| |
| My final chart is a chart of the Gold and Silver index. In times of uncertainty, money looks for a safe haven in Gold and Silver. The chart in Figure 4 shows an Elliott wave count showing a WAVE 5, suggesting that the index could start correcting downwards. Note the RSI Indicator which as given a sell signal. The charts above show the uncertainty that exists in the market at present. The joke circulating the rounds is, "If Hillary Clinton and Donald Trump were stranded on an Iisland in the Pacific, who would be saved? The answer, The United States of America." So, the months leading to the Presidential election, are months of uncertainty. Caution prevails. |
Has been a technical analyst since 1969, and has worked as a futures and options trader with First Financial Futures in Johannesburg, South Africa.
| Address: | 3256 West 24th Ave |
| Vancouver, BC | |
| Phone # for sales: | 6042634214 |
| E-mail address: | petroosp@gmail.com |
Click here for more information about our publications!
Comments
Date: 08/11/16Rank: 1Comment: where is vxx?

Request Information From Our Sponsors
- StockCharts.com, Inc.
- Candle Patterns
- Candlestick Charting Explained
- Intermarket Technical Analysis
- John Murphy on Chart Analysis
- John Murphy's Chart Pattern Recognition
- John Murphy's Market Message
- MurphyExplainsMarketAnalysis-Intermarket Analysis
- MurphyExplainsMarketAnalysis-Visual Analysis
- StockCharts.com
- Technical Analysis of the Financial Markets
- The Visual Investor
- VectorVest, Inc.
- Executive Premier Workshop
- One-Day Options Course
- OptionsPro
- Retirement Income Workshop
- Sure-Fire Trading Systems (VectorVest, Inc.)
- Trading as a Business Workshop
- VectorVest 7 EOD
- VectorVest 7 RealTime/IntraDay
- VectorVest AutoTester
- VectorVest Educational Services
- VectorVest OnLine
- VectorVest Options Analyzer
- VectorVest ProGraphics v6.0
- VectorVest ProTrader 7
- VectorVest RealTime Derby Tool
- VectorVest Simulator
- VectorVest Variator
- VectorVest Watchdog
