HOT TOPICS LIST
- MACD
- Fibonacci
- RSI
- Gann
- ADXR
- Stochastics
- Volume
- Triangles
- Futures
- Cycles
- Volatility
- ZIGZAG
- MESA
- Retracement
- Aroon
INDICATORS LIST
LIST OF TOPICS
PRINT THIS ARTICLE
by Koos van der Merwe
The S&P500 fell like a stone as expected with the announcement of Brexit, then recovered. Now what?
Position: Sell
Koos van der Merwe
Has been a technical analyst since 1969, and has worked as a futures and options trader with First Financial Futures in Johannesburg, South Africa.
PRINT THIS ARTICLE
TECHNICAL ANALYSIS
Post Brexit
07/13/16 05:18:17 PMby Koos van der Merwe
The S&P500 fell like a stone as expected with the announcement of Brexit, then recovered. Now what?
Position: Sell
| The whole of Europe and America was shocked with the vote by England to leave the European Union, but then, surprisingly, the indexes started to recover. The question on everyone's mind is WHY? Is it because the present British Prime Minister, who arranged the Brexit vote, David Cameron, resigned, or is it because of the hope that a newly elected Prime Minister may call for another referendum and that Britain may then reverse the Brexit decision? Analysts have been calling for a market correction. Was this the start of it? What do the charts tell us about the future of the indexes. |

|
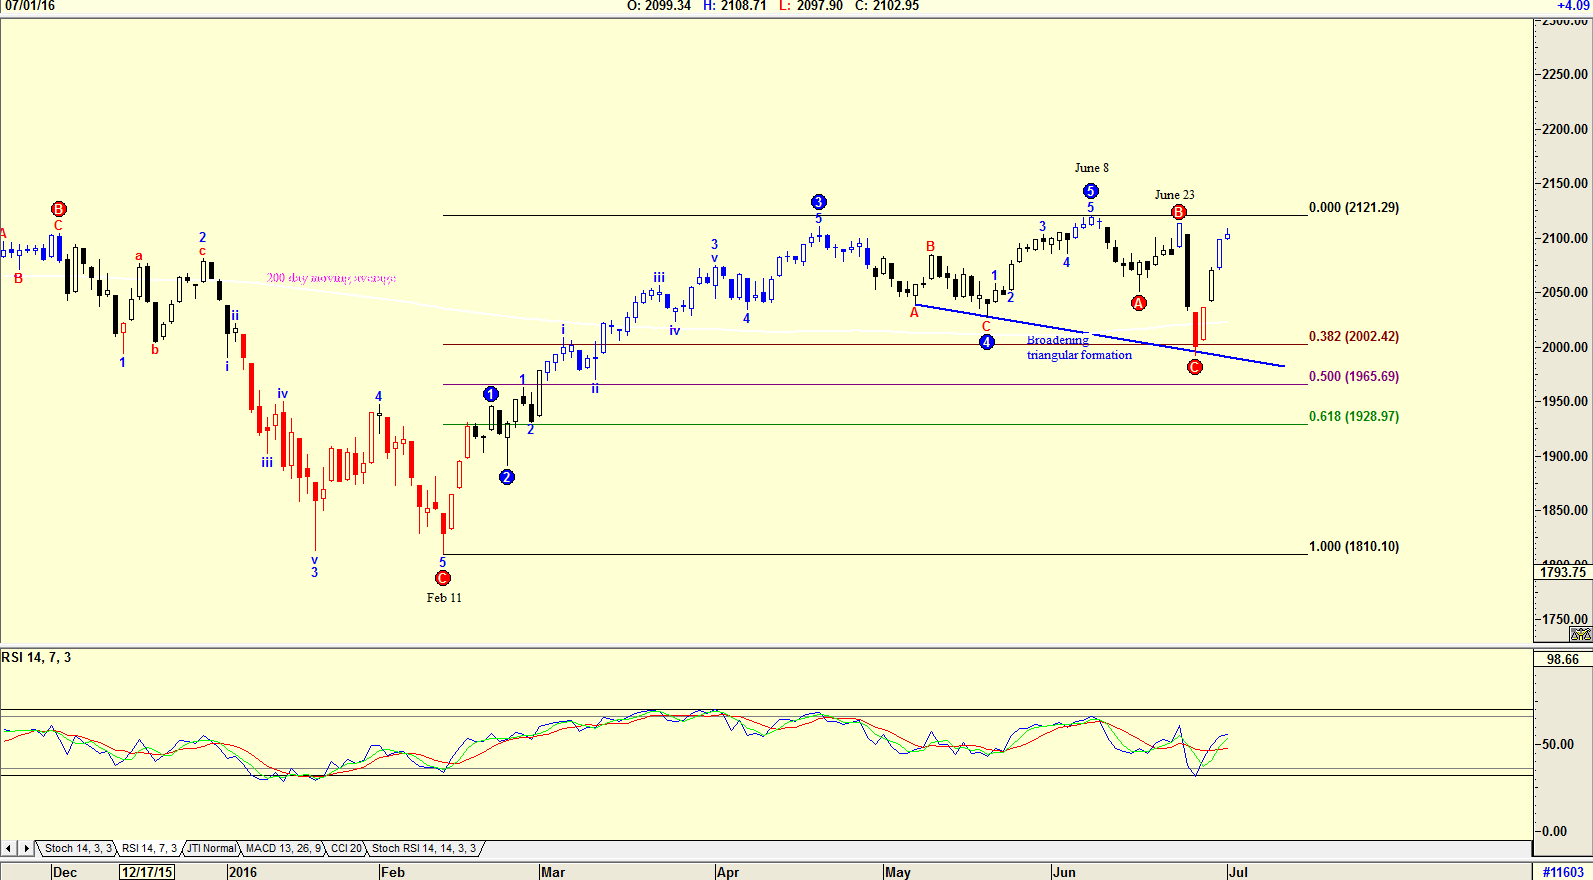
| Figure 1. Daily chart of the S&P500 Index. |
| Graphic provided by: AdvancedGET. |
| |
| The chart in Figure 1 is a daily chart of the S&P500 index with an Elliott wave count showing that the index topped out in a WAVE 5 on June 8th. From that high, the index started falling in an ABC correction with the final C-WAVE falling heavily from June 24th with the Brexit announcement. Notice how the index fell to the 38% Fibonacci correction level. From that level it has recovered strongly to its present high of 2102.95 as of July 1. Do note the broadening triangle formation which is a sign of future uncertainty. Also notice the RSI indicator which is suggesting a buy signal with further upside. |

|
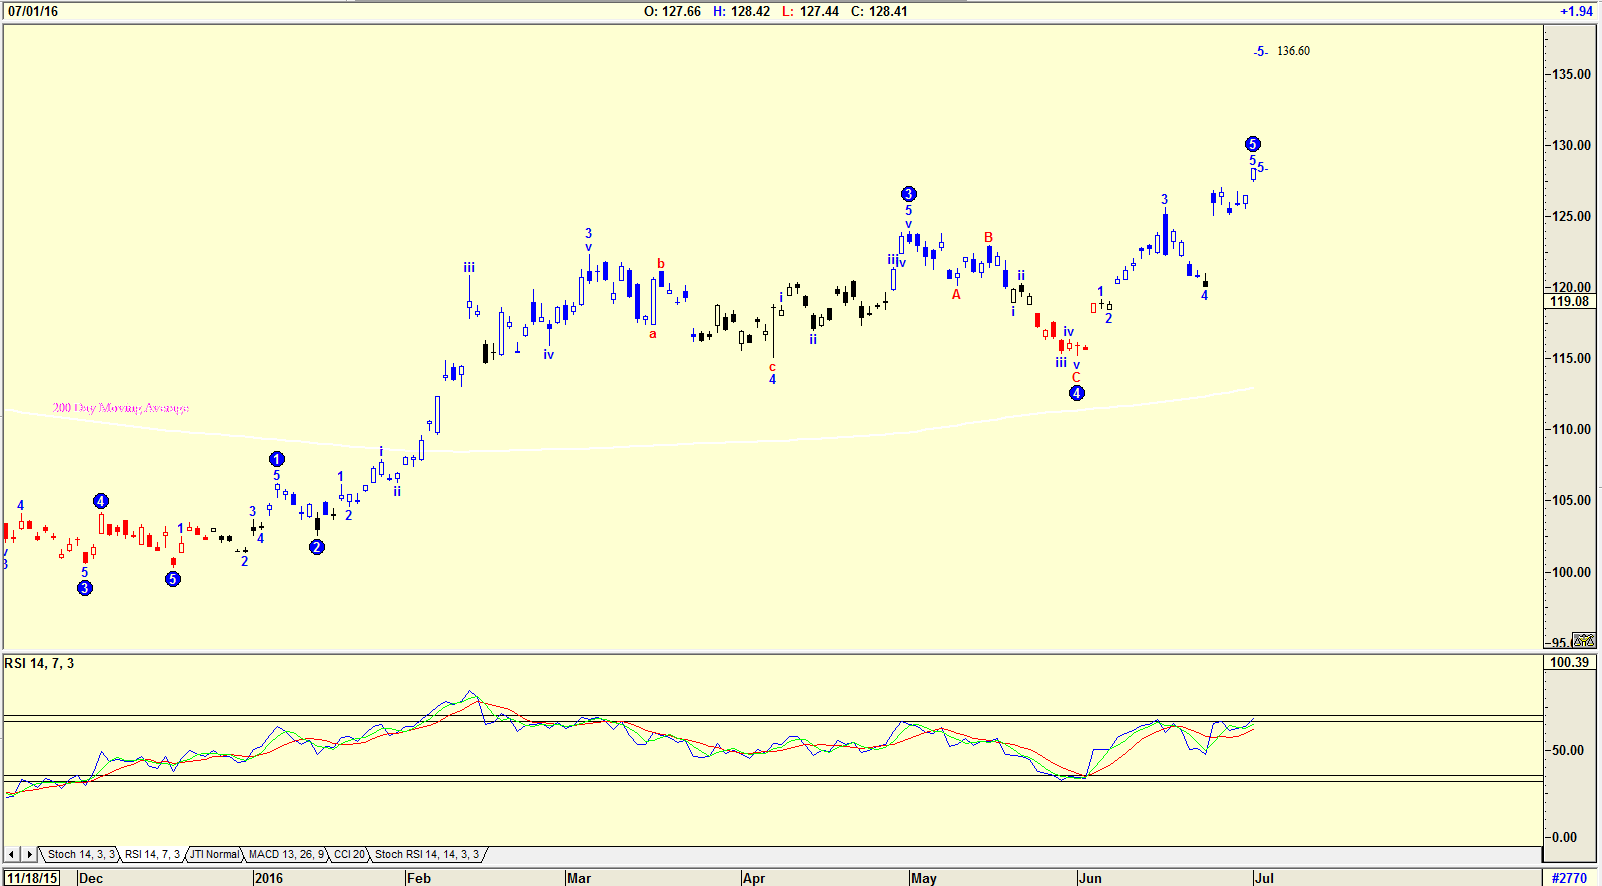
| Figure 2. Daily Chart of the Spiders Gold Index. |
| Graphic provided by: AdvancedGET. |
| |
| The chart in Figure 2 is a chart of the Spider Gold Shares with an Elliott wave count suggesting that the price could rise to 136.60. This means that the price of Gold could rise to $1360.00. The RSI Indicator on the chart is at overbought levels, but has not given a sell signal. Investing in Gold shares has become a safe haven should the stock market correct, with gold rising as the economy weakens. Charts of gold are also an indication of where the stock market is expected to go. With the S&P500 Index suggesting that a market correction may occur, and with the Gold price rising as the S&P 500 Index is rising, an indication of market uncertainty exists, and the rule is, 'when in doubt stay out.' The final vote on Brexit was contrary to what the polls were forecasting. With Europe now unsure of whether Britain possibly leaving the European Union will cause other members to consider leaving, uncertainty in where the market is now going, is there. |
Has been a technical analyst since 1969, and has worked as a futures and options trader with First Financial Futures in Johannesburg, South Africa.
| Address: | 3256 West 24th Ave |
| Vancouver, BC | |
| Phone # for sales: | 6042634214 |
| E-mail address: | petroosp@gmail.com |
Click here for more information about our publications!
PRINT THIS ARTICLE

|

Request Information From Our Sponsors
- StockCharts.com, Inc.
- Candle Patterns
- Candlestick Charting Explained
- Intermarket Technical Analysis
- John Murphy on Chart Analysis
- John Murphy's Chart Pattern Recognition
- John Murphy's Market Message
- MurphyExplainsMarketAnalysis-Intermarket Analysis
- MurphyExplainsMarketAnalysis-Visual Analysis
- StockCharts.com
- Technical Analysis of the Financial Markets
- The Visual Investor
- VectorVest, Inc.
- Executive Premier Workshop
- One-Day Options Course
- OptionsPro
- Retirement Income Workshop
- Sure-Fire Trading Systems (VectorVest, Inc.)
- Trading as a Business Workshop
- VectorVest 7 EOD
- VectorVest 7 RealTime/IntraDay
- VectorVest AutoTester
- VectorVest Educational Services
- VectorVest OnLine
- VectorVest Options Analyzer
- VectorVest ProGraphics v6.0
- VectorVest ProTrader 7
- VectorVest RealTime Derby Tool
- VectorVest Simulator
- VectorVest Variator
- VectorVest Watchdog
