

HOT TOPICS LIST
- MACD
- Fibonacci
- RSI
- Gann
- ADXR
- Stochastics
- Volume
- Triangles
- Futures
- Cycles
- Volatility
- ZIGZAG
- MESA
- Retracement
- Aroon
INDICATORS LIST
LIST OF TOPICS
PRINT THIS ARTICLE
by Stella Osoba, CMT
As part of its 13F filings the quarter ending 3/31/2016, Barrick Gold Corp. (ABX) announced that Soros Fund Management LLC had built up a new and substantial position of some 19,419,309 shares in its company. With the results of the UK referendum currently roiling world markets, this move by the billionaire investor seems almost as stunning as his trade in 1992 in which it was claimed he made a billion dollars by "breaking" the Bank of England. On Friday, June 24, 2016, while the S&P 500 was down 75.91, or 3.59%, ABX was up 1.12, or 5.79%.
Position: N/A
Stella Osoba, CMT
Stella Osoba is a trader and financial writer. She is a frequent contributor to "Technical Analysis of Stocks and Commodities" magazine and "Traders.com Advantage" as well as other financial publications.
PRINT THIS ARTICLE
TECHNICAL ANALYSIS
Anticipating Macro Events
07/06/16 04:33:53 PMby Stella Osoba, CMT
As part of its 13F filings the quarter ending 3/31/2016, Barrick Gold Corp. (ABX) announced that Soros Fund Management LLC had built up a new and substantial position of some 19,419,309 shares in its company. With the results of the UK referendum currently roiling world markets, this move by the billionaire investor seems almost as stunning as his trade in 1992 in which it was claimed he made a billion dollars by "breaking" the Bank of England. On Friday, June 24, 2016, while the S&P 500 was down 75.91, or 3.59%, ABX was up 1.12, or 5.79%.
Position: N/A
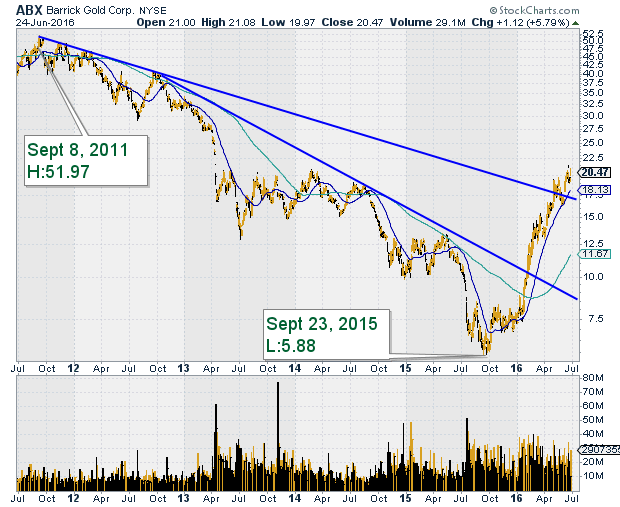
| If we base our analysis on just technicals, would a study of the chart prior to March 2016 have alerted us to take a long position in a timely fashion? After touching a high of 51.97 on September 8, 2011, ABX had been on a lengthy down trend. It dipped to a low of 5.88 on September 23, 2015 (See Figure 1). |
|
| Figure 1. ABX Daily Chart 2011-2016. |
| Graphic provided by: StockCharts.com. |
| |
| Five days later, price successfully tested the September 23rd low and began a rise to break above the 50-day moving average. Price peaked at 8.16 on October 14, 2015 and then began a lengthy sideways move for the next four months. |
| Obviously, during these four months a lot was happening. We can tell that support was coming in because at no time during this period was price allowed to fall below 6.86. On November 6, 2015 price reached 6.68; seven trading days later on November 17, 2015 it dipped to 6.88; the following day it dipped to 6.86. On December 15, 2015 the low was 6.92 and a couple of days later on December 17, 2015 it tested the 6.92 low. These repeated unsuccessful attempts by bears to push the price down points to one significant fact — there was heavy demand for the stock. We now know that perhaps one of those heavy buyers was the George Soros fund. |
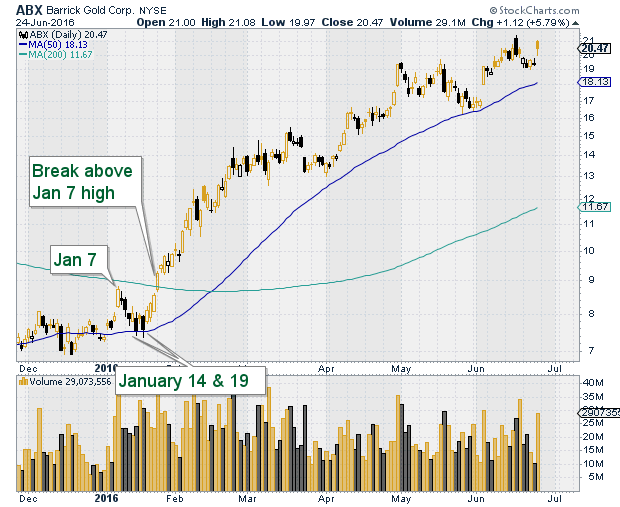
| So what would have been an ideal place to enter a long trade in ABX? On January 14, 2016 a strong bear candle used the 50-day moving average as support. (See Figure 2) On January 19, 2016 another strong bear candle does the exact same thing, meaning the lows have now gotten higher. To take a long position, wait for a strong bull candle to form and then confirmation with a follow through day. The trading on January 20, 2016 formed a bull candle, its upper tail diminishing somewhat from its strength. But the following day was a strong bull candle with no upper tail; this was follow through. You could take a position here. A less aggressive trader would wait until a break above the highs on January 7, 2016 which happened on January 25, 2016. The open on January 25, 2016 was 8.72. The stock closed at 20.42 on June 24, 2016 for an increase of 134%. |
|
| Figure 2: ABX Daily Chart 2016. |
| Graphic provided by: StockCharts.com. |
| |
Stella Osoba is a trader and financial writer. She is a frequent contributor to "Technical Analysis of Stocks and Commodities" magazine and "Traders.com Advantage" as well as other financial publications.
| E-mail address: | stellaosoba@gmail.com |
Click here for more information about our publications!
PRINT THIS ARTICLE

Request Information From Our Sponsors
- StockCharts.com, Inc.
- Candle Patterns
- Candlestick Charting Explained
- Intermarket Technical Analysis
- John Murphy on Chart Analysis
- John Murphy's Chart Pattern Recognition
- John Murphy's Market Message
- MurphyExplainsMarketAnalysis-Intermarket Analysis
- MurphyExplainsMarketAnalysis-Visual Analysis
- StockCharts.com
- Technical Analysis of the Financial Markets
- The Visual Investor
- VectorVest, Inc.
- Executive Premier Workshop
- One-Day Options Course
- OptionsPro
- Retirement Income Workshop
- Sure-Fire Trading Systems (VectorVest, Inc.)
- Trading as a Business Workshop
- VectorVest 7 EOD
- VectorVest 7 RealTime/IntraDay
- VectorVest AutoTester
- VectorVest Educational Services
- VectorVest OnLine
- VectorVest Options Analyzer
- VectorVest ProGraphics v6.0
- VectorVest ProTrader 7
- VectorVest RealTime Derby Tool
- VectorVest Simulator
- VectorVest Variator
- VectorVest Watchdog