HOT TOPICS LIST
- MACD
- Fibonacci
- RSI
- Gann
- ADXR
- Stochastics
- Volume
- Triangles
- Futures
- Cycles
- Volatility
- ZIGZAG
- MESA
- Retracement
- Aroon
INDICATORS LIST
LIST OF TOPICS
PRINT THIS ARTICLE
by Koos van der Merwe
Investing in a pharmaceutical company can be risky, but also extremely profitable.
Position: Sell
Koos van der Merwe
Has been a technical analyst since 1969, and has worked as a futures and options trader with First Financial Futures in Johannesburg, South Africa.
PRINT THIS ARTICLE
TECHNICAL ANALYSIS
Investing In A Pharmaceutical Company
06/29/16 12:59:11 PMby Koos van der Merwe
Investing in a pharmaceutical company can be risky, but also extremely profitable.
Position: Sell
| A pharmaceutical company spends millions of dollars in their research looking for new products that will be a best seller. They then test the drug they have developed hoping that it will pass FDA (Food and Drug Administration) approval, and recoup their expenses plus a small profit. Many years ago, Pfizer Laboratories developed a product to lower blood pressure. A side effect of that product when marketed came to their attention. They withdrew the product from the market, repacked the drug and renamed it VIAGRA, and the product became a bestseller. That is the risk a drug manufacturer takes, and it is very seldom that a product as good a seller as VIAGRA is discovered. To reduces taxes being paid in the USA, Pfizer Laboratories looked to purchase Allergan Laboratories. In that so-called inversion deal, Pfizer would have moved its headquarters to Dublin, Ireland, where Allergan is based. The deal, however, fell through after the US Government effectively blocked the deal. Allergan then started looking to sell its generic business to TEVA Pharmaceutical Industries. On Tuesday, Carl Icahn announced that he had acquired a "large position" in Allergan. So, with so many interested in owning Allergan, are the shares worth a buy? |

|
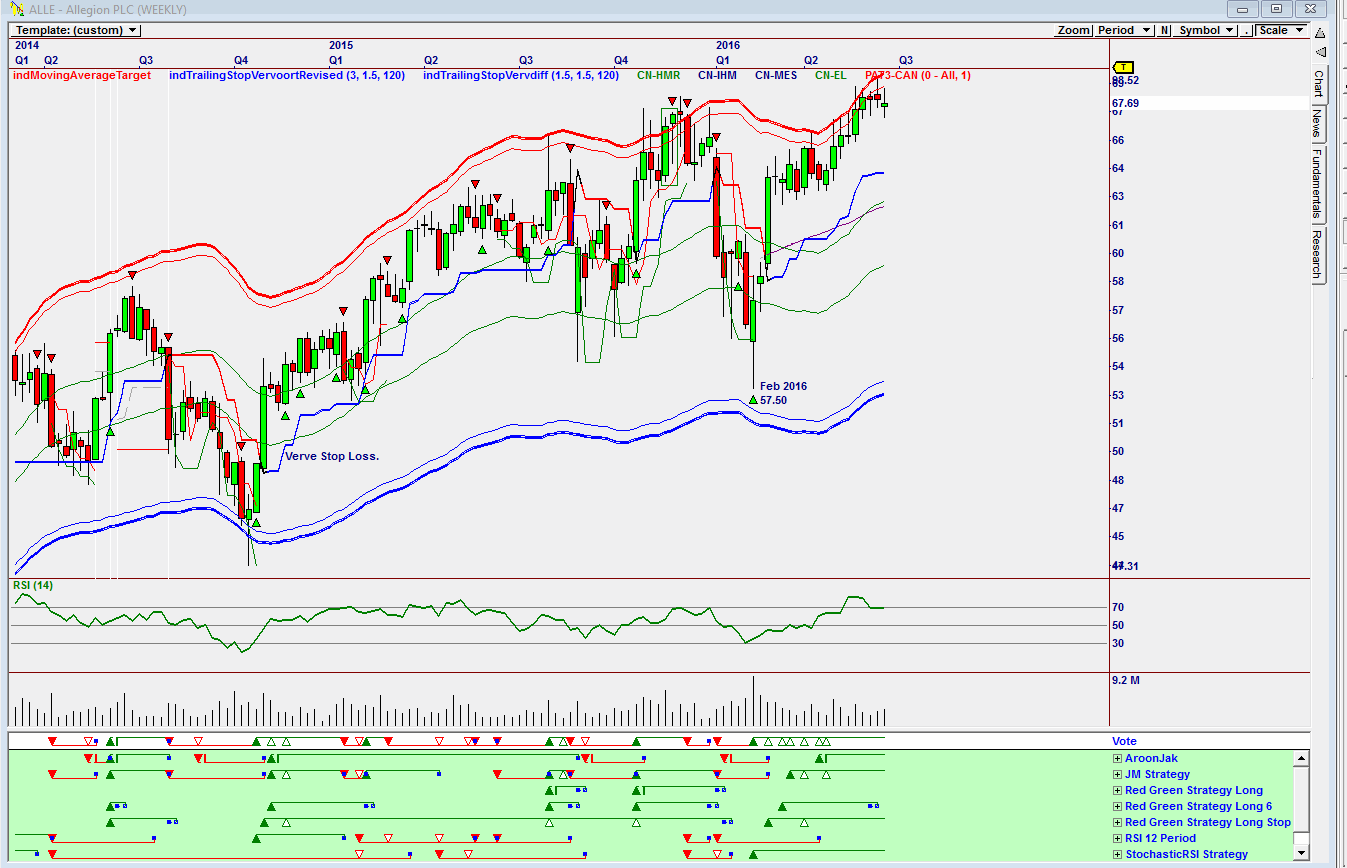
| Figure 1. Weekly chart of Allergan. |
| Graphic provided by: Omnitrader. |
| |
| The chart in Figure 1 is an Omnitrader weekly chart showing that the share price of Allergan suggested a buy in February 2016, when the share price was $57.50. The buy signal on the Vote line was given based on the Stochastic RSI Strategy shown in green below the Vote line. The share is presently trading at $67.69 and the RSI indicator, however, is suggesting that a sell signal could soon be given. |

|
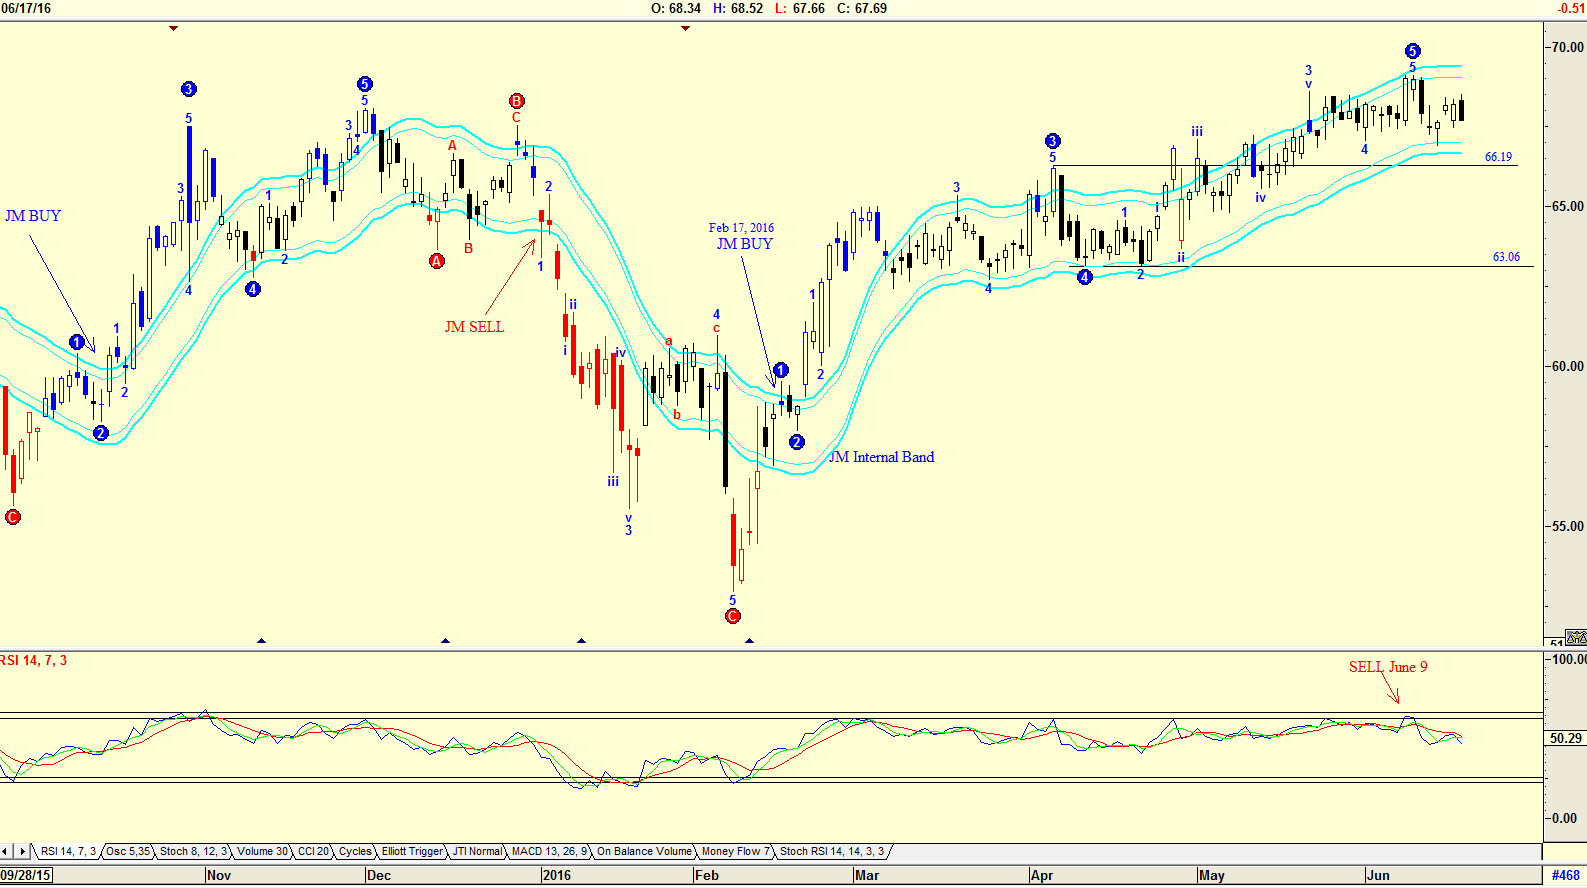
| Figure 2. Daily chart of Allergan. |
| Graphic provided by: AdvancedGET. |
| |
| The chart in Figure 2 is a daily chart with an Elliott wave count suggesting that a WAVE 5 has been completed. The share price should now fall to somewhere between $66.19 and $63.06, the 4th wave of lesser degree. The RSI indicator gave a sell signal on June 9th. Traders could sell now. Investors, however, could wait for the share price to fall below the JM Internal bottom band. The JM Internal Band is a 15 period simple moving average offset by 2% positive and 2% negative. A move above the upper band suggests a buy and a move below the lower band, a sell. With the billionaire activist investor, Carl Icahn, buying a position in Allergan, and with the pharmaceutical company Pfizer having looked at the company in the past as a way to save paying taxes in the USA, this is a share that should be placed on one's watch list, for a long term buy and hold when the timing is right. |
Has been a technical analyst since 1969, and has worked as a futures and options trader with First Financial Futures in Johannesburg, South Africa.
| Address: | 3256 West 24th Ave |
| Vancouver, BC | |
| Phone # for sales: | 6042634214 |
| E-mail address: | petroosp@gmail.com |
Click here for more information about our publications!
Comments

Request Information From Our Sponsors
- StockCharts.com, Inc.
- Candle Patterns
- Candlestick Charting Explained
- Intermarket Technical Analysis
- John Murphy on Chart Analysis
- John Murphy's Chart Pattern Recognition
- John Murphy's Market Message
- MurphyExplainsMarketAnalysis-Intermarket Analysis
- MurphyExplainsMarketAnalysis-Visual Analysis
- StockCharts.com
- Technical Analysis of the Financial Markets
- The Visual Investor
- VectorVest, Inc.
- Executive Premier Workshop
- One-Day Options Course
- OptionsPro
- Retirement Income Workshop
- Sure-Fire Trading Systems (VectorVest, Inc.)
- Trading as a Business Workshop
- VectorVest 7 EOD
- VectorVest 7 RealTime/IntraDay
- VectorVest AutoTester
- VectorVest Educational Services
- VectorVest OnLine
- VectorVest Options Analyzer
- VectorVest ProGraphics v6.0
- VectorVest ProTrader 7
- VectorVest RealTime Derby Tool
- VectorVest Simulator
- VectorVest Variator
- VectorVest Watchdog
