

HOT TOPICS LIST
- MACD
- Fibonacci
- RSI
- Gann
- ADXR
- Stochastics
- Volume
- Triangles
- Futures
- Cycles
- Volatility
- ZIGZAG
- MESA
- Retracement
- Aroon
INDICATORS LIST
LIST OF TOPICS
PRINT THIS ARTICLE
by Koos van der Merwe
Foot Locker is a share that hints it is a possible buy.
Position: Accumulate
Koos van der Merwe
Has been a technical analyst since 1969, and has worked as a futures and options trader with First Financial Futures in Johannesburg, South Africa.
PRINT THIS ARTICLE
TECHNICAL ANALYSIS
Foot Locker Inc.
06/28/16 03:47:55 PMby Koos van der Merwe
Foot Locker is a share that hints it is a possible buy.
Position: Accumulate
| Finding a share where the daily, weekly and monthly charts suggests a possible buy — if not now, then in the very near future — is a share that should be placed on the Watch list. Foot Locker is a share that recently captured my attention. Foot Locker Retail Inc. is a sportswear and footwear retailer operating in approximately 20 countries throughout the world. The company is offering free shipping on over 10,000 items to an order that is over $75. With more and more buyers looking to the internet to do their shopping, buying shares in Foot Locker could be a win-win over the long term. |
|
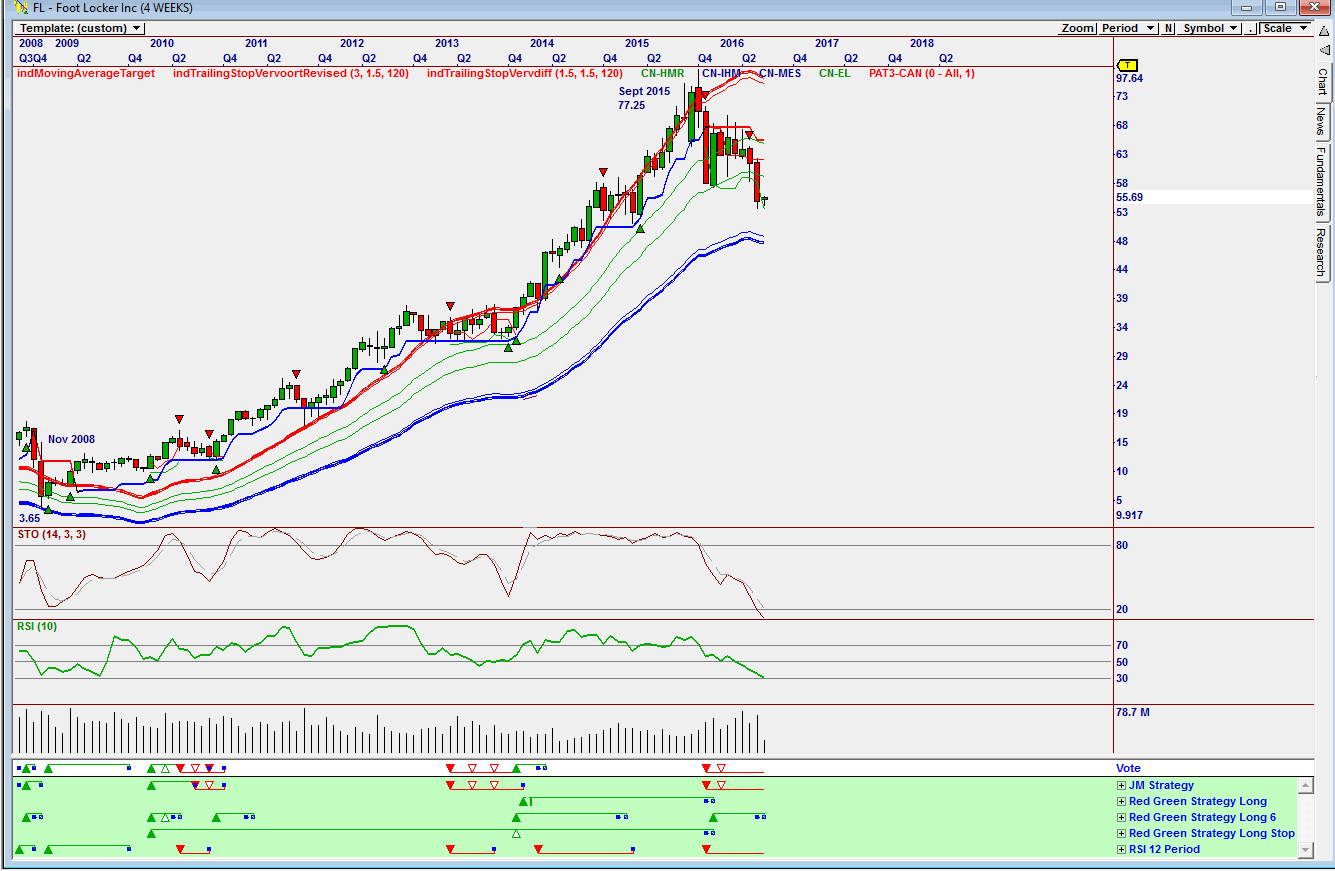
| Figure 1. Monthly chart. |
| Graphic provided by: Omnitrader.. |
| |
| The chart in Figure 1 is a monthly chart showing how the share price has risen from a low of $3.65in November 2008 to a high of $77.25 by September 2015, before correcting to its present share price of $55.69. The Stochastic indicator is at oversold levels and the RSI indicator is approaching RSI levels. The Vote line is however still showing a sell based on the JM Strategy and the RSI 12 Period strategy. |
|
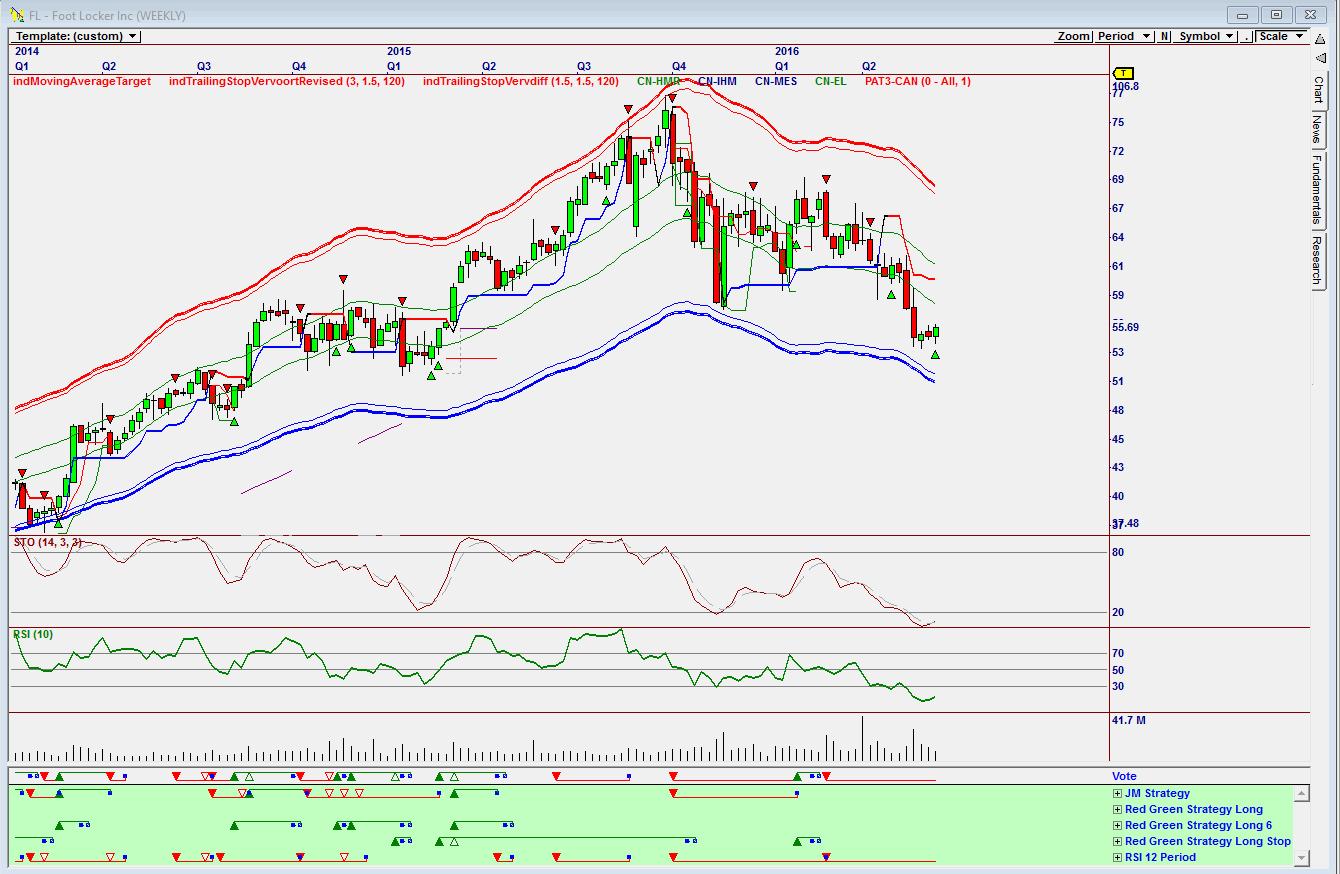
| Figure 2. Weekly chart. |
| Graphic provided by: Omnitrader. |
| |
| The weekly chart in Figure 2 shows the stochastic oscillator at oversold levels and turning upwards. When it breaks above the 20 horizontal line it will suggest a buy. The RSI indicator is also at oversold levels and turning up. A move above the 30 levels would suggest a buy. Do note that the share price is close to the lower band land and that a bullish engulfing day candlestick buy signal has been given. The Vote line is still suggesting a negative trend based on the RSI 12 Period strategy below the Vote line. |
|
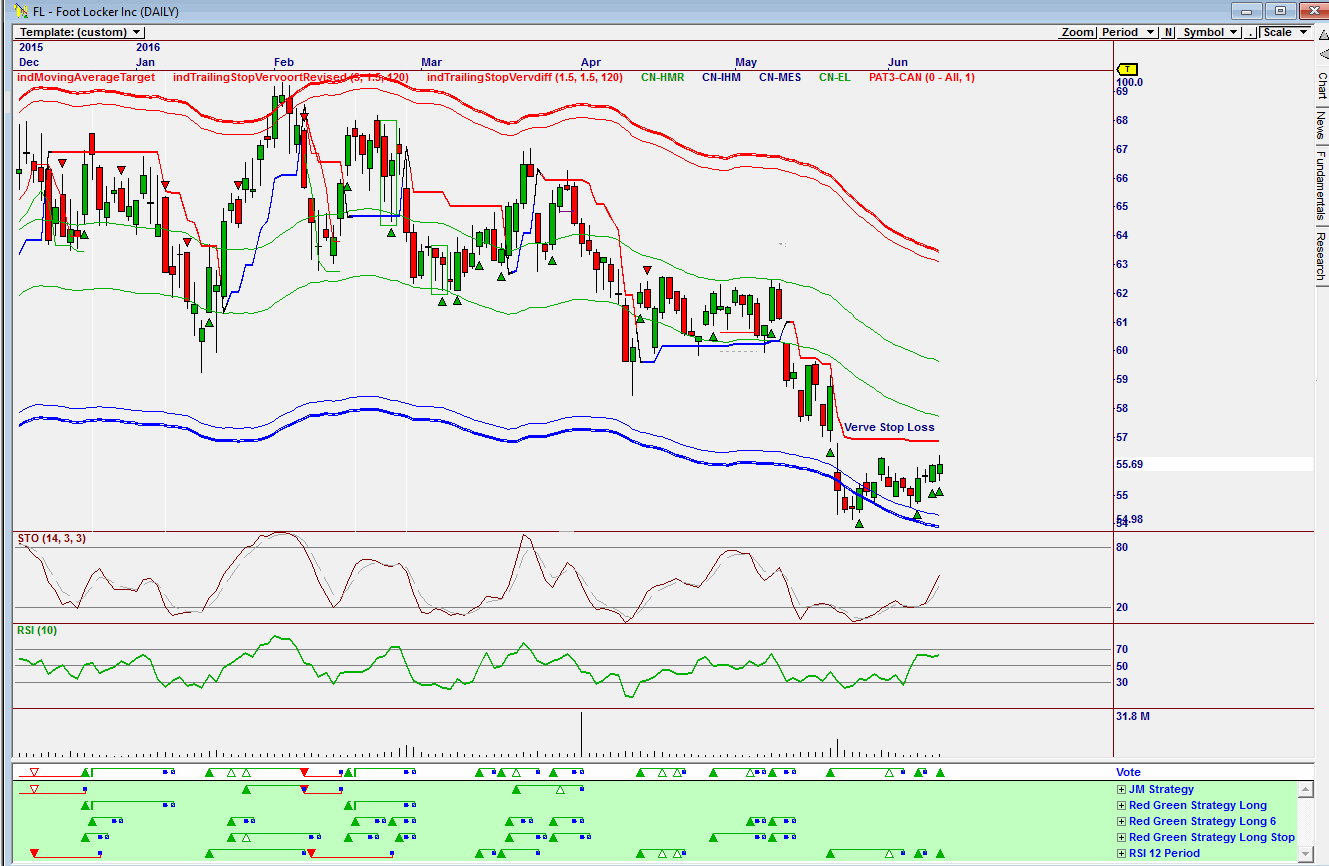
| Figure 3. Daily chart. |
| Graphic provided by: Omnitrader. |
| |
| The Daily chart in Figure 3 shows both the RSI and stochastic indicators have given buy signals as has the Vote line based on the RSI 12 period strategy. The share price has also bounced off the lower band also suggesting a buy. The daily chart has given a buy signal, suggesting that traders could buy the stock at the current price and sell the stock when the stochastic and RSI indicators are overbought. Investors, however, could wait for both the monthly and weekly charts to move into buy mode, and then buy the share when the daily chart suggests a buy. This is a share that is definitely on my watch list. |
Has been a technical analyst since 1969, and has worked as a futures and options trader with First Financial Futures in Johannesburg, South Africa.
| Address: | 3256 West 24th Ave |
| Vancouver, BC | |
| Phone # for sales: | 6042634214 |
| E-mail address: | petroosp@gmail.com |
Click here for more information about our publications!
PRINT THIS ARTICLE

Request Information From Our Sponsors
- VectorVest, Inc.
- Executive Premier Workshop
- One-Day Options Course
- OptionsPro
- Retirement Income Workshop
- Sure-Fire Trading Systems (VectorVest, Inc.)
- Trading as a Business Workshop
- VectorVest 7 EOD
- VectorVest 7 RealTime/IntraDay
- VectorVest AutoTester
- VectorVest Educational Services
- VectorVest OnLine
- VectorVest Options Analyzer
- VectorVest ProGraphics v6.0
- VectorVest ProTrader 7
- VectorVest RealTime Derby Tool
- VectorVest Simulator
- VectorVest Variator
- VectorVest Watchdog
- StockCharts.com, Inc.
- Candle Patterns
- Candlestick Charting Explained
- Intermarket Technical Analysis
- John Murphy on Chart Analysis
- John Murphy's Chart Pattern Recognition
- John Murphy's Market Message
- MurphyExplainsMarketAnalysis-Intermarket Analysis
- MurphyExplainsMarketAnalysis-Visual Analysis
- StockCharts.com
- Technical Analysis of the Financial Markets
- The Visual Investor