

HOT TOPICS LIST
- MACD
- Fibonacci
- RSI
- Gann
- ADXR
- Stochastics
- Volume
- Triangles
- Futures
- Cycles
- Volatility
- ZIGZAG
- MESA
- Retracement
- Aroon
INDICATORS LIST
LIST OF TOPICS
PRINT THIS ARTICLE
by Stella Osoba, CMT
Negatives divergences can be useful signals to alert us to possible reversals, but it is wise to remember that confirmation to enter trades must always come from price because no signal is fool proof. All trading signals can fail.
Position: N/A
Stella Osoba, CMT
Stella Osoba is a trader and financial writer. She is a frequent contributor to "Technical Analysis of Stocks and Commodities" magazine and "Traders.com Advantage" as well as other financial publications.
PRINT THIS ARTICLE
TECHNICAL ANALYSIS
Failed Divergence
06/22/16 04:33:50 PMby Stella Osoba, CMT
Negatives divergences can be useful signals to alert us to possible reversals, but it is wise to remember that confirmation to enter trades must always come from price because no signal is fool proof. All trading signals can fail.
Position: N/A
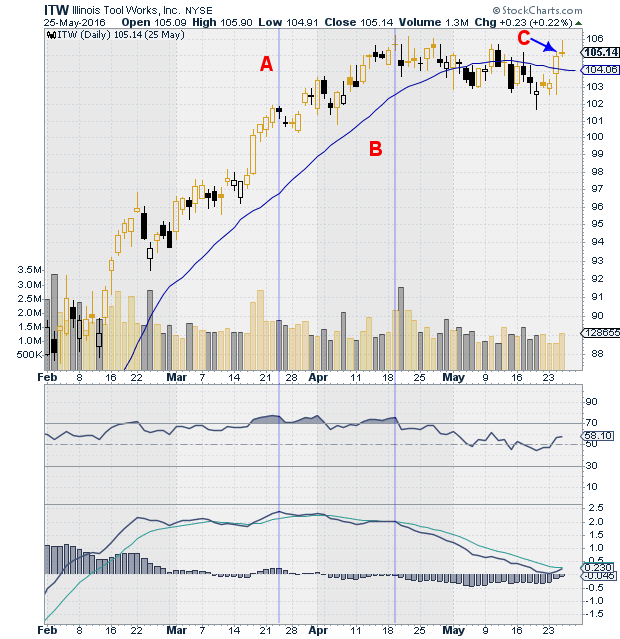
| Negative divergence is when price is making higher highs, but the indicator is not. This points to slowing momentum and can be a useful early warning of a pending reversal. The chart of Illinois Toolworks, Inc. (ITW) will be used to illustrate this occurrence. In Figure 1, if you look at the higher highs price makes at points A and B and follow the vertical lines to compare these points with the indicators below at the same points, it is clear that both RSI and MACD fail to confirm. Both indicators are not making higher highs, but price is. |
|
| Figure 1. Daily chart for ITW. Notice the negative divergence; as price makes higher highs and A and B, the indicators do not. |
| Graphic provided by: StockCharts.com. |
| |
| It is tempting to take this early warning signal as confirmation to enter a short trade. But a trade should never be taken off a warning signal given by an indicator. Confirmation must always come from price itself. |
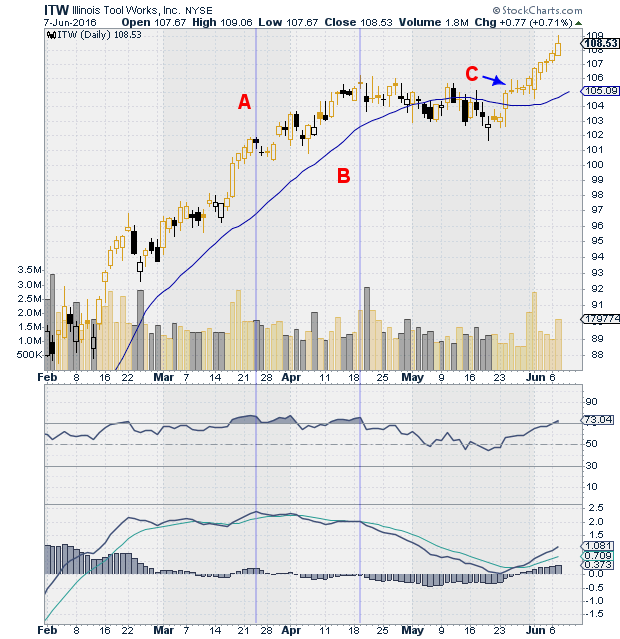
| So if a trade had been taken say at C, in anticipation of a coming reversal, since by this time RSI and MACD had clearly begun sloping down, what would have happened to our short trade? A look at Figure 2 shows the results of anticipating price action before waiting for confirmation from price. After the doji forms at C, the next two trading days are also dojis which points to uncertainty, not good signals to enter a trade in any direction. The following day is a bullish candle which does not bode well for our short position, then another strong bullish candle the following day forms an inside day which points to more uncertainty. This is followed by another series of bullish candles. Note that none of the candles forming since we entered our early short trade are bearish. So there were clearly no good candles which would have given confirmation of the signal coming from the indicators to enter a short trade. |
|
| Figure 2. Daily chart for ITW. Price has not confirmed the negative divergence. |
| Graphic provided by: StockCharts.com. |
| |
| When ITW does eventually reverse, it is possible that hindsight will show that the signals given by the indicators did provide early warning of the reversal, but this will be no comfort to the trader sitting on losses. It is always best to wait for the actual turning point in price to enter the trade. Use indicators as they are meant to be used; as early warning signals to be alert and pay close attention to price action. |
Stella Osoba is a trader and financial writer. She is a frequent contributor to "Technical Analysis of Stocks and Commodities" magazine and "Traders.com Advantage" as well as other financial publications.
| E-mail address: | stellaosoba@gmail.com |
Click here for more information about our publications!
PRINT THIS ARTICLE

Request Information From Our Sponsors
- StockCharts.com, Inc.
- Candle Patterns
- Candlestick Charting Explained
- Intermarket Technical Analysis
- John Murphy on Chart Analysis
- John Murphy's Chart Pattern Recognition
- John Murphy's Market Message
- MurphyExplainsMarketAnalysis-Intermarket Analysis
- MurphyExplainsMarketAnalysis-Visual Analysis
- StockCharts.com
- Technical Analysis of the Financial Markets
- The Visual Investor
- VectorVest, Inc.
- Executive Premier Workshop
- One-Day Options Course
- OptionsPro
- Retirement Income Workshop
- Sure-Fire Trading Systems (VectorVest, Inc.)
- Trading as a Business Workshop
- VectorVest 7 EOD
- VectorVest 7 RealTime/IntraDay
- VectorVest AutoTester
- VectorVest Educational Services
- VectorVest OnLine
- VectorVest Options Analyzer
- VectorVest ProGraphics v6.0
- VectorVest ProTrader 7
- VectorVest RealTime Derby Tool
- VectorVest Simulator
- VectorVest Variator
- VectorVest Watchdog