

HOT TOPICS LIST
- MACD
- Fibonacci
- RSI
- Gann
- ADXR
- Stochastics
- Volume
- Triangles
- Futures
- Cycles
- Volatility
- ZIGZAG
- MESA
- Retracement
- Aroon
INDICATORS LIST
LIST OF TOPICS
PRINT THIS ARTICLE
by Koos van der Merwe
With the present uncertainty in the stock market, looking for a stock to invest in for the long term is a must.
Position: Accumulate
Koos van der Merwe
Has been a technical analyst since 1969, and has worked as a futures and options trader with First Financial Futures in Johannesburg, South Africa.
PRINT THIS ARTICLE
ELLIOTT WAVE
A Share For The Watch List
06/21/16 04:12:15 PMby Koos van der Merwe
With the present uncertainty in the stock market, looking for a stock to invest in for the long term is a must.
Position: Accumulate
| "Sell in May and go away" is on everyone's mind. Many, however, forget that one sells at the top (May) and watch the market fall in June and even the months that follow. With so many stock market experts calling for the market to start correcting, looking for a long term safe investment is on everyone's mind. As the US dollar starts weakening against the Canadian dollar, looking at Canada is possibly one of the ways to go. One should, however, not forget that the Canadian market will also weaken alongside the American market, but there are long term shares that could be a comfortable bet. One of those shares is WestJet. WestJet Airlines Ltd is a Canadian airline that began as a low-cost alternative to Canada's major airlines. The airline company is slowly extending its destinations and becoming more and more popular with Canadian travelers. Looking at the company for a long term investment is a true possibility. |
|
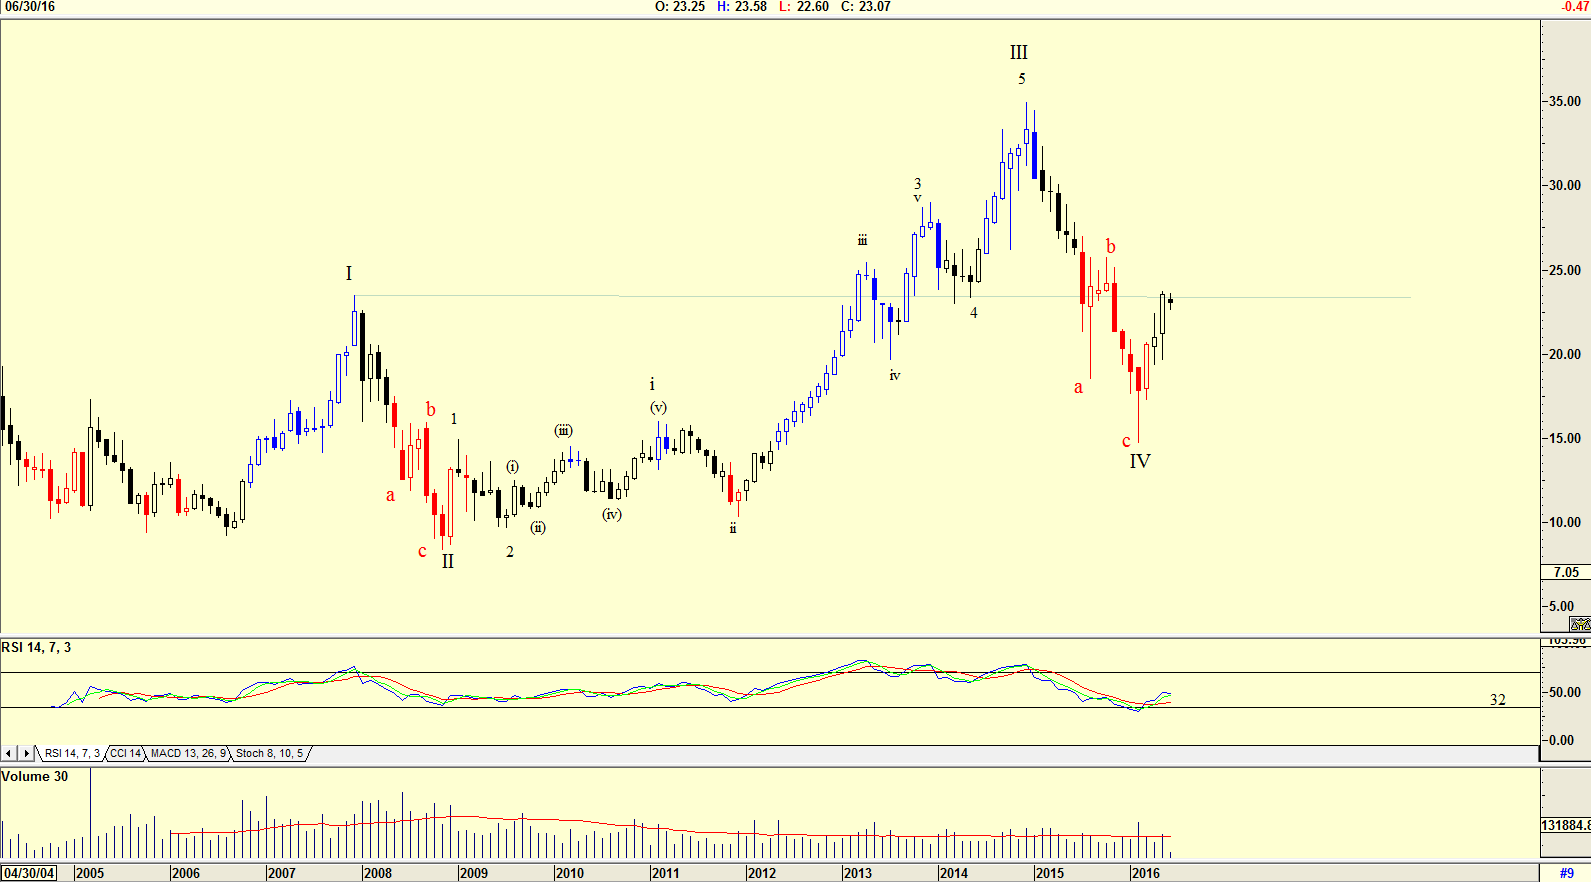
| Figure 1. Monthly chart for WestJet with Elliott wave count. |
| Graphic provided by: AdvancedGET. |
| |
| The chart in Figure 1 is a monthly chart with an Elliott wave count suggesting that the share price could be rising in a WAVE V. This is confirmed by the RSI indicator which has given a buy signal by crossing above the 32 horizontal line. However, the fact that the WAVE IV has fallen below the high of WAVE I as shown by the horizontal line makes the wave count suspect. The Elliott wave rule is that a Wave 4 shall not fall below the high of a Wave 1. However, with the RSI suggesting a buy, the share should be on one's watch list. |
|
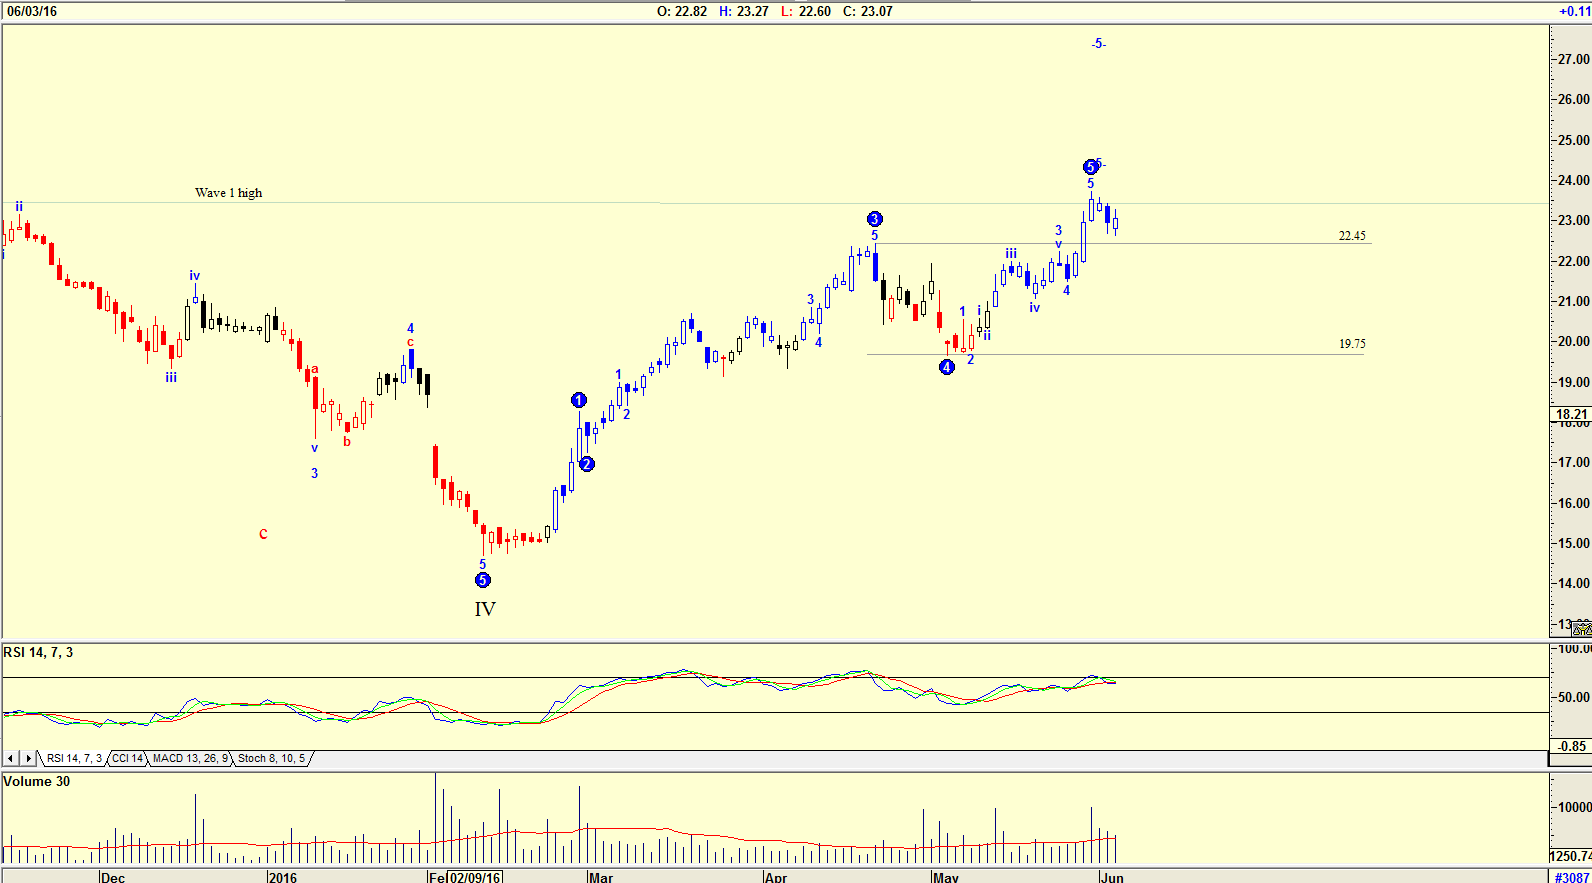
| Figure 2. Daily chart for WestJet with Elliott wave count. |
| Graphic provided by: AdvancedGET. |
| |
| The chart in Figure 2 is a daily chart with an Elliott wave count suggesting a Wave 5 top at the WAVE I high shown on the monthly chart in Figure 1. The RSI count is is at overbought levels and is suggesting that a correction will occur, with the price falling to somewhere between $19.75 and $22.45; the 4th wave of lesser degree. Over the past three days as the share price fell, so did the volume. A falling share price on falling volume suggests that the share price could start moving up. Looking for a safe haven other than the mattress of your bed, should the major correction that all the experts are suggesting could occur in 2016, is not easy. Caution always prevails — "when in doubt, stay out." However, there will always be stocks that are contrarian and preparing a watch list of stocks that look likely to rise as the market falls is a must. WestJet is one of those shares that should be added to the watch list. |
Has been a technical analyst since 1969, and has worked as a futures and options trader with First Financial Futures in Johannesburg, South Africa.
| Address: | 3256 West 24th Ave |
| Vancouver, BC | |
| Phone # for sales: | 6042634214 |
| E-mail address: | petroosp@gmail.com |
Click here for more information about our publications!
PRINT THIS ARTICLE

Request Information From Our Sponsors
- StockCharts.com, Inc.
- Candle Patterns
- Candlestick Charting Explained
- Intermarket Technical Analysis
- John Murphy on Chart Analysis
- John Murphy's Chart Pattern Recognition
- John Murphy's Market Message
- MurphyExplainsMarketAnalysis-Intermarket Analysis
- MurphyExplainsMarketAnalysis-Visual Analysis
- StockCharts.com
- Technical Analysis of the Financial Markets
- The Visual Investor
- VectorVest, Inc.
- Executive Premier Workshop
- One-Day Options Course
- OptionsPro
- Retirement Income Workshop
- Sure-Fire Trading Systems (VectorVest, Inc.)
- Trading as a Business Workshop
- VectorVest 7 EOD
- VectorVest 7 RealTime/IntraDay
- VectorVest AutoTester
- VectorVest Educational Services
- VectorVest OnLine
- VectorVest Options Analyzer
- VectorVest ProGraphics v6.0
- VectorVest ProTrader 7
- VectorVest RealTime Derby Tool
- VectorVest Simulator
- VectorVest Variator
- VectorVest Watchdog