

HOT TOPICS LIST
- MACD
- Fibonacci
- RSI
- Gann
- ADXR
- Stochastics
- Volume
- Triangles
- Futures
- Cycles
- Volatility
- ZIGZAG
- MESA
- Retracement
- Aroon
INDICATORS LIST
LIST OF TOPICS
PRINT THIS ARTICLE
by Stella Osoba, CMT
Sometimes when you look at a chart, you see what has happened recently and this informs your decision about what should happen next. This decision then determines how you subsequently trade and can result in costly mistakes, especially in the case of the fake-out. For what should happen next must never be a basis for your trading decisions. The only analysis that really matters is the one that tells you what is currently happening.
Position: N/A
Stella Osoba, CMT
Stella Osoba is a trader and financial writer. She is a frequent contributor to "Technical Analysis of Stocks and Commodities" magazine and "Traders.com Advantage" as well as other financial publications.
PRINT THIS ARTICLE
TECHNICAL ANALYSIS
Ben's Fake-out Or Why You Must Trust the Chart
06/15/16 01:19:30 PMby Stella Osoba, CMT
Sometimes when you look at a chart, you see what has happened recently and this informs your decision about what should happen next. This decision then determines how you subsequently trade and can result in costly mistakes, especially in the case of the fake-out. For what should happen next must never be a basis for your trading decisions. The only analysis that really matters is the one that tells you what is currently happening.
Position: N/A
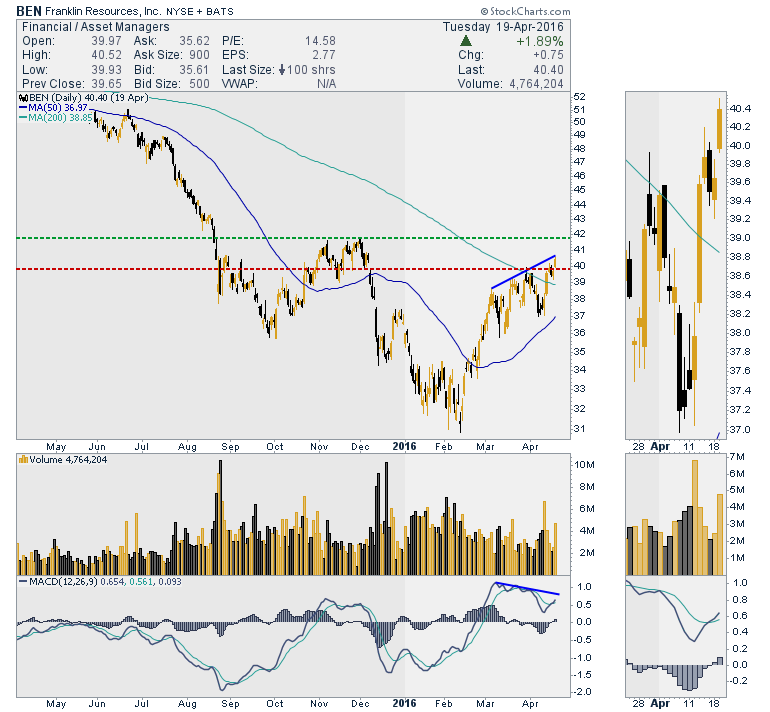
| Since peaking at a high of 57.62 on December 8, 2014, Franklin Resources, Inc. (BEN) had been in a lengthy downtrend. It bottomed on February 11, 2016 at a low of 30.85. The following day price gapped up, forming a bullish candle. Had you entered the trade that day to ride the uptrend, you might have expected the uptrend to be tested at the former resistance level (See green dotted line in Figure 1). Also, the former support level (Figure 1, red dotted line) had the potential of becoming new resistance. So it would have been wise to watch carefully as price approached that level. |
|
| Figure 1. |
| Graphic provided by: StockCharts.com. |
| |
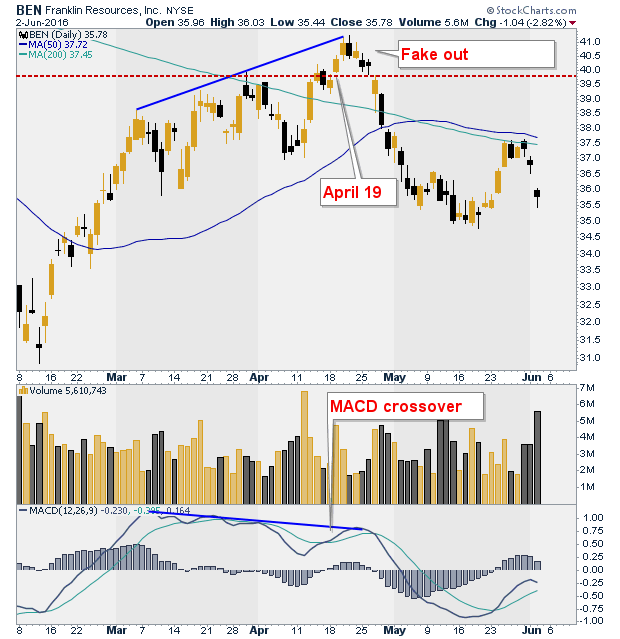
| As price approached the red dotted line on March 30, 2016, it reacted as might have been expected. (See Figure 2) But since price was still forming higher highs and higher lows, you stayed in the position. The next approach to the resistance line was on April 14, 2016. There was a one bar reaction and then price moved higher and on the second day showed a convincing bullish close above the line. You congratulated yourself for hanging in there. However, even though from March 4, 2016 until April 21, 2016, BEN continued to form higher highs and higher lows, signs of two sided trading had clearly begun to appear. In fact, were you to connect the highs from March 4, 2016 to April 21, 2016, to the lows from March 10, 2016 to April 26, 2016, you would have an upward sloping channel. |
|
| Figure 2. |
| Graphic provided by: StockCharts.com. |
| |
| But perhaps you were focused on the fact that price was making higher highs and higher lows, therefore it was in an uptrend. The next resistance level you might have decided should be at the green dotted line. But apart from the upward sloping channel there were other signs of trouble appearing on the chart. The MACD line was making lower highs, even as price was making higher highs. Then on April 19, 2016, you had cause for optimism in the face of increasingly mixed signals. Price gapped up to new highs and the MACD line turned up over the signal line and zero line (See Figure 2). So you decide price should now get to the second resistance level (green dotted line) before it turns down. |
| It is at times like these when it is very important to trust the chart and maintain your focus in the present. An objective reading of the signals would have shown that even though the MACD line had turned up, it was still trending lower, showing that momentum was slowing. The best strategy in this case would have been to sell into strength, which would have been on the following day, April 20, 2016, when price gapped up a second day in a row. Or you could have exited on the day after, on the 21st when the candles formed a bearish reversal pattern. Hindsight would come to show that the high culminating on April 21, 2016 at 41.24 was a fake-out. A reading of what the chart was telling you it was doing would have gotten you out before the damage was done to the chart or your account. |
Stella Osoba is a trader and financial writer. She is a frequent contributor to "Technical Analysis of Stocks and Commodities" magazine and "Traders.com Advantage" as well as other financial publications.
| E-mail address: | stellaosoba@gmail.com |
Click here for more information about our publications!
Comments
Date:�06/15/16Rank:�1Comment:�

Request Information From Our Sponsors
- VectorVest, Inc.
- Executive Premier Workshop
- One-Day Options Course
- OptionsPro
- Retirement Income Workshop
- Sure-Fire Trading Systems (VectorVest, Inc.)
- Trading as a Business Workshop
- VectorVest 7 EOD
- VectorVest 7 RealTime/IntraDay
- VectorVest AutoTester
- VectorVest Educational Services
- VectorVest OnLine
- VectorVest Options Analyzer
- VectorVest ProGraphics v6.0
- VectorVest ProTrader 7
- VectorVest RealTime Derby Tool
- VectorVest Simulator
- VectorVest Variator
- VectorVest Watchdog
- StockCharts.com, Inc.
- Candle Patterns
- Candlestick Charting Explained
- Intermarket Technical Analysis
- John Murphy on Chart Analysis
- John Murphy's Chart Pattern Recognition
- John Murphy's Market Message
- MurphyExplainsMarketAnalysis-Intermarket Analysis
- MurphyExplainsMarketAnalysis-Visual Analysis
- StockCharts.com
- Technical Analysis of the Financial Markets
- The Visual Investor