HOT TOPICS LIST
- MACD
- Fibonacci
- RSI
- Gann
- ADXR
- Stochastics
- Volume
- Triangles
- Futures
- Cycles
- Volatility
- ZIGZAG
- MESA
- Retracement
- Aroon
INDICATORS LIST
LIST OF TOPICS
PRINT THIS ARTICLE
by Stella Osoba, CMT
May 18th, 2016 makes it a year since Ascena (ASNA) announced its acquisition of ANN stores for a mixture of cash; financed by debt and stock. The deal created one of the largest specialty retailers in North America with a total of over 4,900 stores. In the year since the deal closed ASNA shareholders have not seen any upside value.
Position: N/A
Stella Osoba, CMT
Stella Osoba is a trader and financial writer. She is a frequent contributor to "Technical Analysis of Stocks and Commodities" magazine and "Traders.com Advantage" as well as other financial publications.
PRINT THIS ARTICLE
TECHNICAL ANALYSIS
The Bird That Shrunk After Swallowing Its Rival
06/08/16 04:05:49 PMby Stella Osoba, CMT
May 18th, 2016 makes it a year since Ascena (ASNA) announced its acquisition of ANN stores for a mixture of cash; financed by debt and stock. The deal created one of the largest specialty retailers in North America with a total of over 4,900 stores. In the year since the deal closed ASNA shareholders have not seen any upside value.
Position: N/A
| ASNA paid Ann's shareholders $37.34 in cash financed by bank debt and 0.68 of ASNA shares for each Ann share they held, representing $47 per share. At the time this was a premium of 21% on the closing price of ANN shares on May 17, 2015. On May 31, 2016 with its share price closing at 7.22 ASNA's total market capitalization was about $1.40 billion — or less than the amount paid to acquire their former rival. |
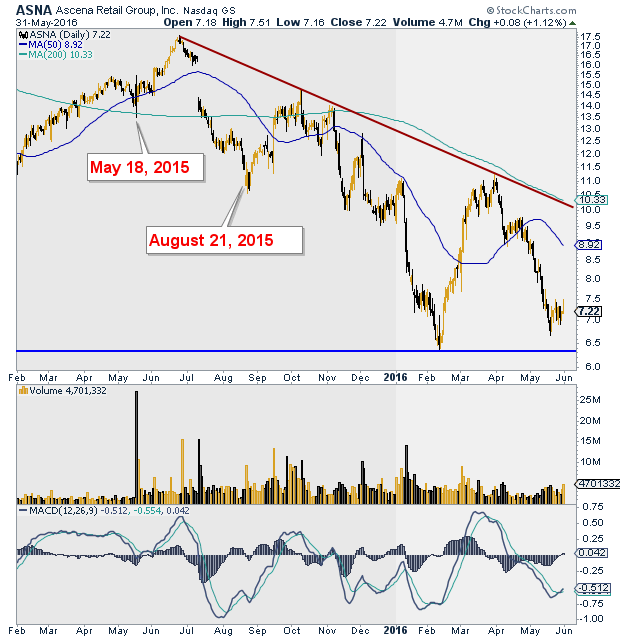
| So what do the technicals tell us about performance of this stock? On May 18, 2015 when it was publicly announced that ASNA planned to purchase ANN, the stock price of ASNA which had been in an up trend, fell amid extremely heavy trading to close at 14.07. This was a buying climax which would have been an opportunity for some institutions to begin to lighten their positions amid very heavy trading. Roughly a month later, on June 23, 2015, the stock peaked and it has been in a downtrend ever since (see Figure 1). By August 21, 2015, when the acquisition of ANN was complete, shares of ASNA had fallen to 11.22. |

|
| Figure 1. ASNA Daily Chart. |
| Graphic provided by: StockCharts.com. |
| |
| The news on the technical front has not been good since. A look at the daily chart of ASNA shows a stock in a significant downtrend making a series of lower lows and lower highs. The weekly chart simply confirms the bearishness of the daily chart. |
| But glimmers of positive news may well wait ahead. On February 10, 2016, ASNA closed at a low of 6.48. The stock subsequently made a successful test of that low on May 18, 2016 and turned up. It is early days yet, though, as the company announced quarterly earnings on May 31, 2016. If, despite a missed quarterly earnings report, ASNA is able to hold above support in the region of 6.33 and with the MACD line showing signs of life by rising above its signal line, ASNA could finally digest its former rival and return some value to its shareholders. |
Stella Osoba is a trader and financial writer. She is a frequent contributor to "Technical Analysis of Stocks and Commodities" magazine and "Traders.com Advantage" as well as other financial publications.
| E-mail address: | stellaosoba@gmail.com |
Click here for more information about our publications!
PRINT THIS ARTICLE

Request Information From Our Sponsors
- VectorVest, Inc.
- Executive Premier Workshop
- One-Day Options Course
- OptionsPro
- Retirement Income Workshop
- Sure-Fire Trading Systems (VectorVest, Inc.)
- Trading as a Business Workshop
- VectorVest 7 EOD
- VectorVest 7 RealTime/IntraDay
- VectorVest AutoTester
- VectorVest Educational Services
- VectorVest OnLine
- VectorVest Options Analyzer
- VectorVest ProGraphics v6.0
- VectorVest ProTrader 7
- VectorVest RealTime Derby Tool
- VectorVest Simulator
- VectorVest Variator
- VectorVest Watchdog
- StockCharts.com, Inc.
- Candle Patterns
- Candlestick Charting Explained
- Intermarket Technical Analysis
- John Murphy on Chart Analysis
- John Murphy's Chart Pattern Recognition
- John Murphy's Market Message
- MurphyExplainsMarketAnalysis-Intermarket Analysis
- MurphyExplainsMarketAnalysis-Visual Analysis
- StockCharts.com
- Technical Analysis of the Financial Markets
- The Visual Investor
