HOT TOPICS LIST
- MACD
- Fibonacci
- RSI
- Gann
- ADXR
- Stochastics
- Volume
- Triangles
- Futures
- Cycles
- Volatility
- ZIGZAG
- MESA
- Retracement
- Aroon
INDICATORS LIST
LIST OF TOPICS
PRINT THIS ARTICLE
by Stella Osoba, CMT
A look at CF's chart will show that it topped on June 17, 2015, reaching a high of 68.10 in a buying climax marked by unusually high volume. This marked the start of its sustained and protracted downtrend. By January 20, 2016, with the stock trading at 25.57, it was down 63% from its high.
Position: N/A
Stella Osoba, CMT
Stella Osoba is a trader and financial writer. She is a frequent contributor to "Technical Analysis of Stocks and Commodities" magazine and "Traders.com Advantage" as well as other financial publications.
PRINT THIS ARTICLE
TECHNICAL ANALYSIS
A Quick Look at CF Industries Holdings, Inc.
06/01/16 02:15:43 PMby Stella Osoba, CMT
A look at CF's chart will show that it topped on June 17, 2015, reaching a high of 68.10 in a buying climax marked by unusually high volume. This marked the start of its sustained and protracted downtrend. By January 20, 2016, with the stock trading at 25.57, it was down 63% from its high.
Position: N/A
| CF Industries which is based in Deerfield, Illinois, manufactures and distributes agriculture fertilizers. It was founded in 1946 as a farmers agricultural supply cooperative, named the Central Farmers Fertilizer Company. It demutualized in 2002 and went public in 2005. |
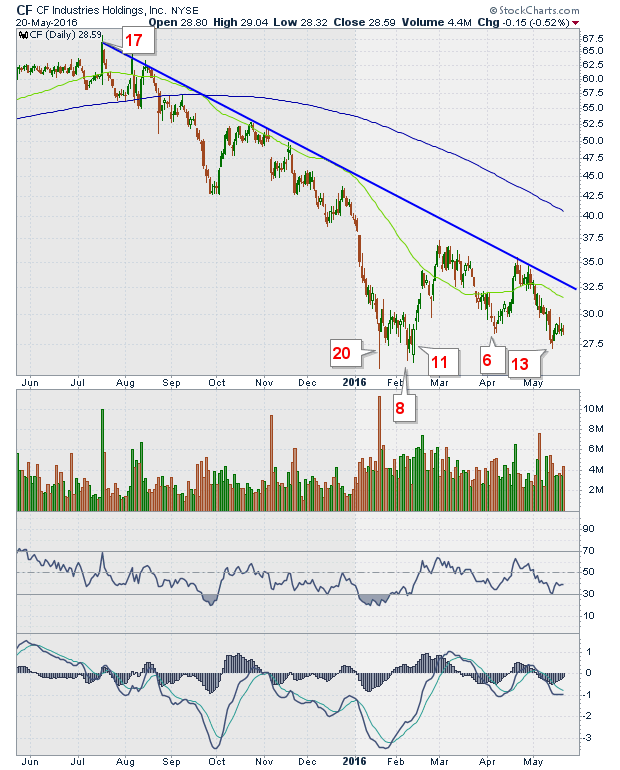
| CF's downtrend lasted through the second half of 2015. On January 20, 2016, price touched a low of 25.57 in a wide range day which saw unusually high volume of over 11.1 million shares changing hands. This was a classic selling climax, with panicky sellers rushing to offload their stocks at the lows. The stock closed that day in the upper half of its range. Price subsequently went nowhere for the following two weeks and then on February 8 and Feb 11, it attempted to test its January 20 low. The test was successful because at 26.20 and 26.03 respectively the January 20 low held, showing that there was sufficient buying coming in to halt any further declines. |

|
| Figure 1: Daily chart for CF. |
| Graphic provided by: StockCharts.com. |
| |
| On April 6, 2016, the stock price touched a low of 28.42 and rebounded. Its most recent test of the January 20 low was on May 13 when it touched 27.15, meaning that the January 20 support was still holding. For any trade there is risk and for some it is early to take a long position. It is acceptable to wait for further proof that the stock is acting correctly, such as a break above the down trend line or a rise above the moving average. But an aggressive trader might look for early signs of a reversal from price action supported by indicators such as the MACD line turning up and an absence of divergence with price. A stop below the January 20 lows should protect an early long entry. |
Stella Osoba is a trader and financial writer. She is a frequent contributor to "Technical Analysis of Stocks and Commodities" magazine and "Traders.com Advantage" as well as other financial publications.
| E-mail address: | stellaosoba@gmail.com |
Click here for more information about our publications!
Comments

Request Information From Our Sponsors
- StockCharts.com, Inc.
- Candle Patterns
- Candlestick Charting Explained
- Intermarket Technical Analysis
- John Murphy on Chart Analysis
- John Murphy's Chart Pattern Recognition
- John Murphy's Market Message
- MurphyExplainsMarketAnalysis-Intermarket Analysis
- MurphyExplainsMarketAnalysis-Visual Analysis
- StockCharts.com
- Technical Analysis of the Financial Markets
- The Visual Investor
- VectorVest, Inc.
- Executive Premier Workshop
- One-Day Options Course
- OptionsPro
- Retirement Income Workshop
- Sure-Fire Trading Systems (VectorVest, Inc.)
- Trading as a Business Workshop
- VectorVest 7 EOD
- VectorVest 7 RealTime/IntraDay
- VectorVest AutoTester
- VectorVest Educational Services
- VectorVest OnLine
- VectorVest Options Analyzer
- VectorVest ProGraphics v6.0
- VectorVest ProTrader 7
- VectorVest RealTime Derby Tool
- VectorVest Simulator
- VectorVest Variator
- VectorVest Watchdog
