

HOT TOPICS LIST
- MACD
- Fibonacci
- RSI
- Gann
- ADXR
- Stochastics
- Volume
- Triangles
- Futures
- Cycles
- Volatility
- ZIGZAG
- MESA
- Retracement
- Aroon
INDICATORS LIST
LIST OF TOPICS
PRINT THIS ARTICLE
by Koos van der Merwe
Yahoo, once pop of the tops, now hopefully pops from the pots.
Position: Sell
Koos van der Merwe
Has been a technical analyst since 1969, and has worked as a futures and options trader with First Financial Futures in Johannesburg, South Africa.
PRINT THIS ARTICLE
TECHNICAL ANALYSIS
YAHOO
05/31/16 03:08:26 PMby Koos van der Merwe
Yahoo, once pop of the tops, now hopefully pops from the pots.
Position: Sell
| Marissa Mayer, CEO of Yahoo, led the development of Google's most successful products for more than 10 years. She was appointed CEO of Yahoo in 2012. The company was besieged by declining stock prices, layoffs and slowing ad revenue and her challenge was to turn the company around, In early 2000, the stock price of Yahoo was $118.75, but dropped to $14-$19 in the months before Marissa Mayer joined the company. Today Yahoo is trading at approximately $37.00, so she has achieved some success.\ Recently, Warren Buffett stated that he would possibly finance Dan Gilbert of Quicken Loans in his bid to buy Yahoo. "I'm an enormous admirer of Dan and what he has accomplished in Quicken Loans. Yahoo is not the type of thing I'd ever be an equity partner in. I don't know the business and wouldn't know how to evaluate it, but if Dan needed financing, with proper terms and protections, we would be a possible financing help," Buffett told CNBC. So with Warren Buffett prepared to put money into Quicken Loans should it decide to buy Yahoo, is Yahoo worth a buy? What do the charts tell us? |
|
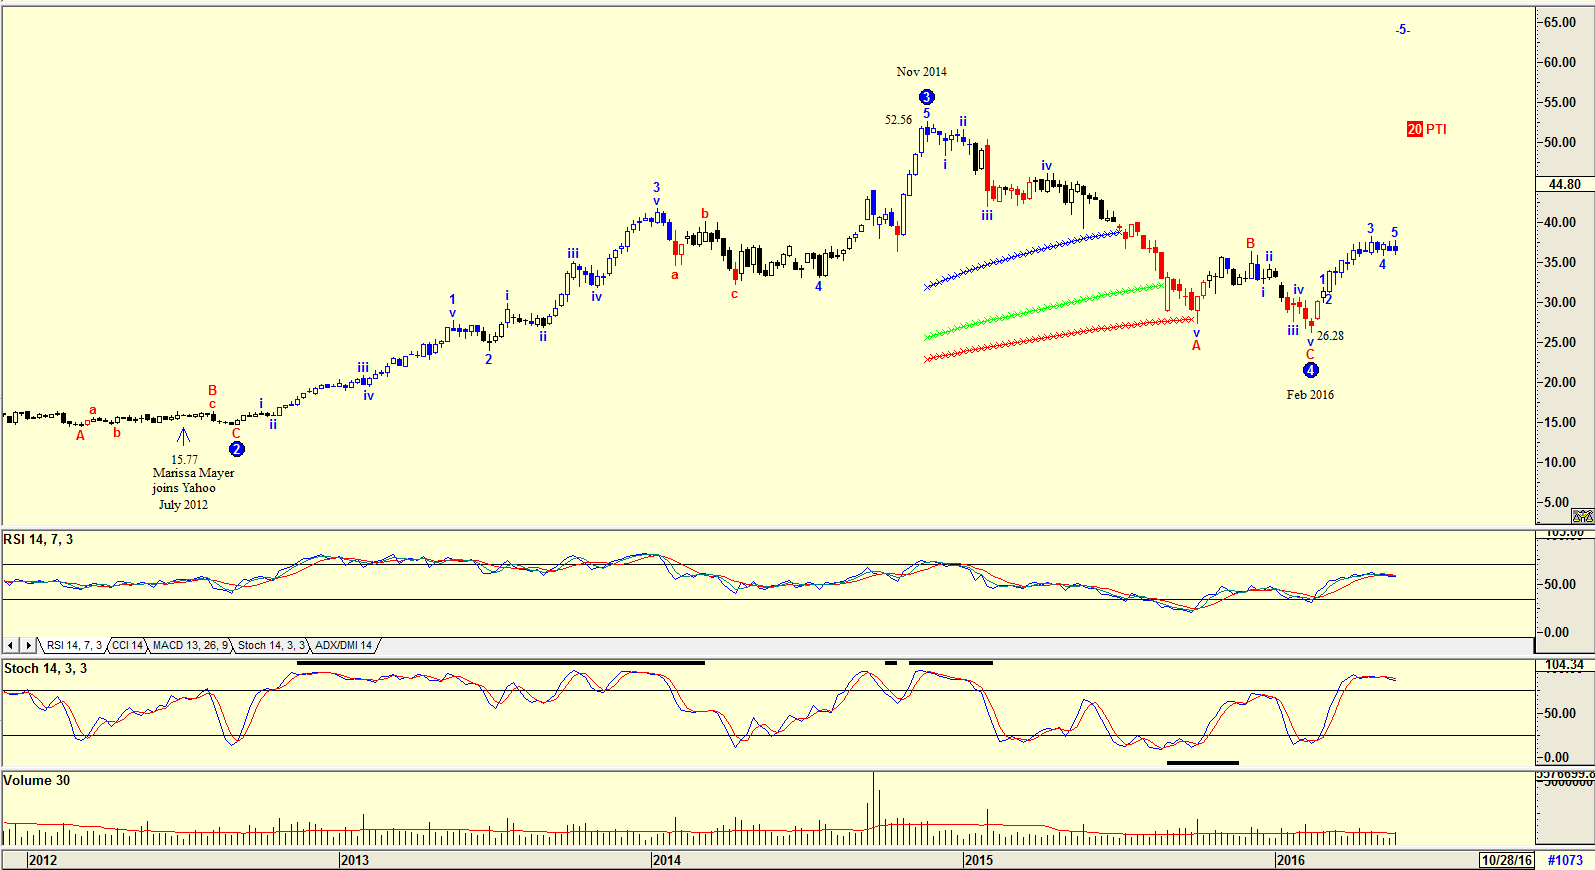
| Figure 1. Weekly chart for YHOO. |
| Graphic provided by: AdvancedGET. |
| |
| The chart in Figure 1 is a weekly chart showing how the share price of Yahoo moved from a low of $15.77 when Marissa Mayer joined the company to a high of $52.56 by November 2014. From that high the share price has slowly deteriorated to a low of $26.28 by February 2016. The RSI indicator is trending up suggesting that the share could still be a buy. The stochastic indicator has however reached overbought levels. The Elliott wave count suggested by the Advanced GET program is showing that the share price traced a 4th wave correction. However, the PTI (Probability Index) at 20 is very weak, suggesting that the share price will not rise to the Wave 5 target shown on the chart. |
|
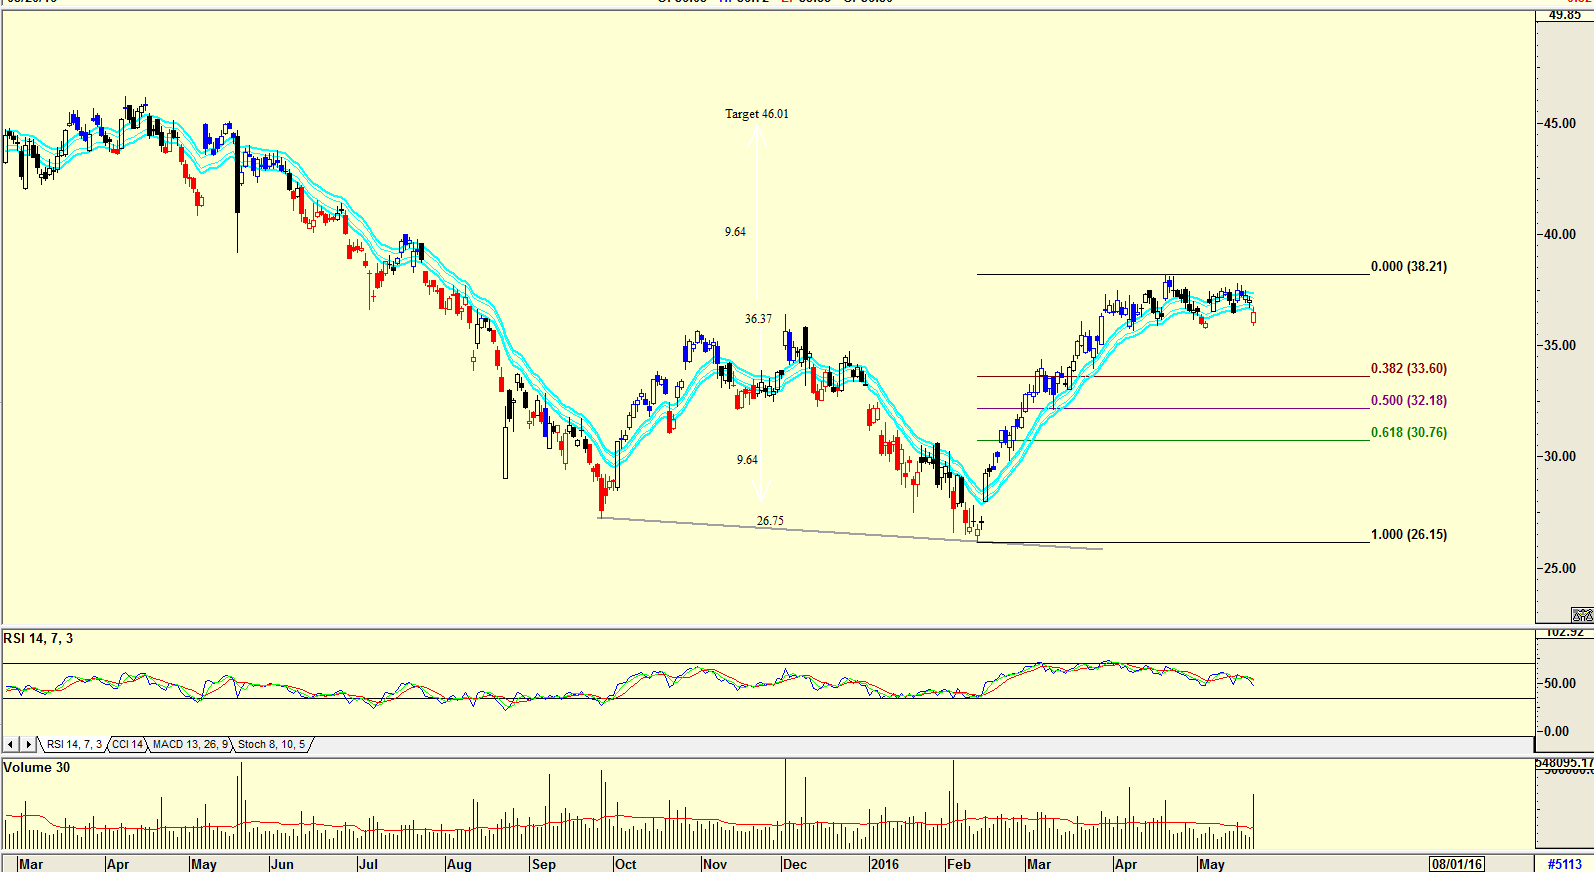
| Figure 2. YHOO daily chart showing 'W' pattern. |
| Graphic provided by: AdvancedGET. |
| |
| The chart in Figure 2 is a daily chart showing a 'W' pattern — a pattern that is formed when a double bottom is made. The pattern suggests that the share price could rise to $46.01 (36.37-26.75=9.64. 36.37+9.64=46.01). With the RSI indicator trending down and suggesting weakness, the Fibonacci retracement suggests that the share price could fall to the 38.2% retracement level of $33.60 or the 50% retracement level before rising to the target price. Volume on Friday, May 20 was high as the share price rose, probably as a result of the announcement by Warren Buffett. Is it time to buy Yahoo? The chart suggests that the company did extremely well after the appointment of Marissa Mayer as CEO, then the share price fell to a low of $26.15 before recovering to $38.21. Is this one of the reasons the company has decided to sell its core asset to Quicken Loans, dissatisfaction with the performance of Marissa Mayer? Should she get the ax after helping facilitate a deal, they would probably have to pay her $37 million in a severance package. Yahoo, is a share I would stay away from, not because of technical analysis, but because of future doubt as to where the company is going. |
Has been a technical analyst since 1969, and has worked as a futures and options trader with First Financial Futures in Johannesburg, South Africa.
| Address: | 3256 West 24th Ave |
| Vancouver, BC | |
| Phone # for sales: | 6042634214 |
| E-mail address: | petroosp@gmail.com |
Click here for more information about our publications!
Comments

Request Information From Our Sponsors
- StockCharts.com, Inc.
- Candle Patterns
- Candlestick Charting Explained
- Intermarket Technical Analysis
- John Murphy on Chart Analysis
- John Murphy's Chart Pattern Recognition
- John Murphy's Market Message
- MurphyExplainsMarketAnalysis-Intermarket Analysis
- MurphyExplainsMarketAnalysis-Visual Analysis
- StockCharts.com
- Technical Analysis of the Financial Markets
- The Visual Investor
- VectorVest, Inc.
- Executive Premier Workshop
- One-Day Options Course
- OptionsPro
- Retirement Income Workshop
- Sure-Fire Trading Systems (VectorVest, Inc.)
- Trading as a Business Workshop
- VectorVest 7 EOD
- VectorVest 7 RealTime/IntraDay
- VectorVest AutoTester
- VectorVest Educational Services
- VectorVest OnLine
- VectorVest Options Analyzer
- VectorVest ProGraphics v6.0
- VectorVest ProTrader 7
- VectorVest RealTime Derby Tool
- VectorVest Simulator
- VectorVest Variator
- VectorVest Watchdog