HOT TOPICS LIST
- MACD
- Fibonacci
- RSI
- Gann
- ADXR
- Stochastics
- Volume
- Triangles
- Futures
- Cycles
- Volatility
- ZIGZAG
- MESA
- Retracement
- Aroon
INDICATORS LIST
LIST OF TOPICS
PRINT THIS ARTICLE
by Billy Williams
Catching an emerging trend is as close to the "holy grail" as it gets, and Monsanto is setting up to take off.
Position: Buy
Billy Williams
Billy Williams has been trading the markets for 27 years, specializing in momentum trading with stocks and options.
PRINT THIS ARTICLE
TECHNICAL ANALYSIS
MON's Phoenix is Rising
05/31/16 02:58:48 PMby Billy Williams
Catching an emerging trend is as close to the "holy grail" as it gets, and Monsanto is setting up to take off.
Position: Buy
| By nature, some of the best stock pickers are contrarian. Why? Because, as night follows day, tomorrow's stock leaders emerge out of today's forgotten markets, like a phoenix rising out of the ashes. Apple was once written off as a lost cause. Oil traded below $10 a barrel over 20 years ago. In the early 1990s, IBM missed the first dividend payment in its history and almost went bankrupt. But, all of them recovered. Even better, they went on to make stellar gains after most traders wrote them off as done and over with. Tomorrow's future super-stocks exist in places that other traders have long forgotten. Once a stock is hot, then most traders will jump in to avoid missing out on future profits. But, what the average trader does will only give them average results. By taking the road less traveled and combining it with a mix of patience and selectivity you can find bargain stocks that are about to make runaway moves once again. So, what's the lesson? |
| First, understand that being a contrarian is more then just doing the opposite of what everyone else is doing. More than that, it's seeing what others cannot or are not willing to. When the housing market was booming, no one that was involved wanted to ask if it would ever end. In fact, most traders who were benefiting from home building stocks, finance companies, and debt instruments argued the case that it would continue forever. And, if not forever, then far off in the future, too far to be concerned with. For a contrarian, such thinking is a sign that an opportunity is in the making. In trading, most traders seek out the "holy grail" in the form of some new trading system or fancy-named indicator. Never does it appear that hard work and disciplined application of a reliable trading method comes to mind. The "trend is your friend" may be tried-and-true but, frankly, it's boring to the mass of traders. This is unfortunate, but true. But, considering the facts, catching an emerging new trend is as close to the holy grail as one can get. |

|
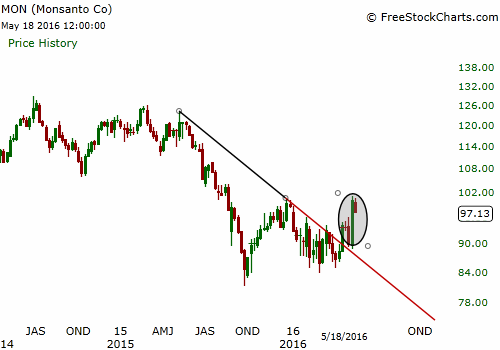
| Figure 1. MON Weekly Chart. In mid-March of 2016, price violated the trendline but failed to follow through and stay above it. But the warning signal had met the first condition for Sperandeoís change in trend. On April 19, MONís stock price traded up through its trendline for the second time. But, this time, it convincingly traded through the trendline while also following through. |
| Graphic provided by: Freestockcharts.com. |
| |
| But you need a trading method to tell you when a change in trend is about to occur. That, and when the market has switched sides and reversed direction. First, identify the time frame that you're going to be trading on. Then, connect the lowest price low to the highest price low that precedes the highest price high without passing through prices between the two points. Then, extend the trendline forward to track future price movement. For a downtrend, connect the highest high price point to the lowest minor high price point preceding the lowest price high without passing through any of the price action between the two points. And, like the upward trendline, extend the trendline forward to track any future price movement. Once you've done that, you'll be able to have a visual reference of the stock's price movement. Next, in his book, "Trader Vic - Methods of a Wall Street Master", Victor Sperandeo details 3 events that reveal a change in the trend. They are: 1. A trendline is broken by price action. 2. A trend, if bullish, stops making higher highs and higher lows in its price action. If bearish, it stops making lower high and lower lows in its price action. 3. Prices rally above a previous short-term minor price high in a bearish trend or rally below a previous short-term minor price low in a bullish trend. |
| As each of these conditions are met, the likelihood of a price reversal increases. Using the trendline, you're job is to identify the first break of the trendline and wait for the other conditions to be met. Now, sometimes price will trade along the trendline or through it before recovering and resuming the original direction. This is why it's important to use the other events as confirmation that a trend reversal is confirmed. With each of the first two events being triggered, the higher the probability of a trend reversal. With the final event being triggered, the reversal is all but confirmed. As a contrarian, using this method can give you the tools to spot when out-of-favor markets or stocks are about to make a comeback. Right now, Monsanto (MON) is experiencing such a price reversal. From May to December 2015, MON experienced a steep decline in its stock price. Drawing a trendline from the two highest price points, as detailed previously, you can spot the downward trend. In mid-March 2016, price violated the trendline but failed to follow through and stay above it. But the warning signal had met the first condition for Sperandeo's change in trend. |

|
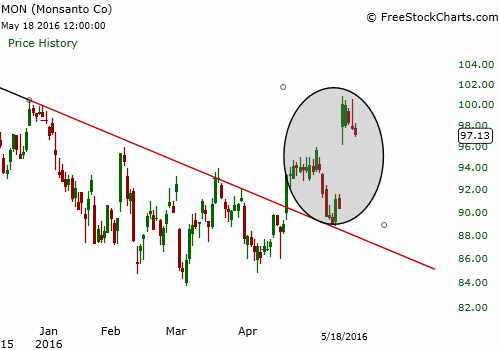
| Figure 2. MON Daily Chart. MON went on to trade higher and eventually set a new price high in the opposite direction on May 2nd. This event triggered the second condition of Sperandeoís rules for spotting a change in trend. Price declined from this new price high but then turned around and traded higher, setting up a new price low set on May 9th. A bullish price gap followed a few days later to push the stock higher into its new trend. |
| Graphic provided by: Freestockcharts.com. |
| |
| On April 19, MON's stock price traded up through its trendline for the second time. But, this time, it convincingly traded through the trendline while also following through. The result was that the stock went on to trade higher and eventually set a new price high in the opposite direction on May 2. This event triggered the second condition of Sperandeo's rules for spotting a change in trend. Price declined from this new price high but then turned around and traded higher, setting up a new price low set on May 9th. A bullish price gap followed a few days later to push the stock higher into it's new trend. If not for the huge price gap, a buy point could have been triggered off the high of May 2, but it would be better to wait. If price consolidates after this gap, then another buy point off the high of May 12 at $111 would be valid. Time will tell. If it does, then MON has a good chance of emerging in a new trend. To increase your odds, it helps to have the overall market trending in the new direction. Reference the DOW and SPX for confirmation. In the meantime, while waiting to see if MON sets up, using these rules as a guideline will help you identify a new trend in markets that are either out-of-favor or highly popular. Both types are ripe for a reversal eventually. And, the end result is higher profits and an increased risk/reward ratio. |
Billy Williams has been trading the markets for 27 years, specializing in momentum trading with stocks and options.
| Company: | StockOptionSystem.com |
| E-mail address: | stockoptionsystem.com@gmail.com |
Traders' Resource Links | |
| StockOptionSystem.com has not added any product or service information to TRADERS' RESOURCE. | |
Click here for more information about our publications!
PRINT THIS ARTICLE

Request Information From Our Sponsors
- StockCharts.com, Inc.
- Candle Patterns
- Candlestick Charting Explained
- Intermarket Technical Analysis
- John Murphy on Chart Analysis
- John Murphy's Chart Pattern Recognition
- John Murphy's Market Message
- MurphyExplainsMarketAnalysis-Intermarket Analysis
- MurphyExplainsMarketAnalysis-Visual Analysis
- StockCharts.com
- Technical Analysis of the Financial Markets
- The Visual Investor
- VectorVest, Inc.
- Executive Premier Workshop
- One-Day Options Course
- OptionsPro
- Retirement Income Workshop
- Sure-Fire Trading Systems (VectorVest, Inc.)
- Trading as a Business Workshop
- VectorVest 7 EOD
- VectorVest 7 RealTime/IntraDay
- VectorVest AutoTester
- VectorVest Educational Services
- VectorVest OnLine
- VectorVest Options Analyzer
- VectorVest ProGraphics v6.0
- VectorVest ProTrader 7
- VectorVest RealTime Derby Tool
- VectorVest Simulator
- VectorVest Variator
- VectorVest Watchdog
