

HOT TOPICS LIST
- MACD
- Fibonacci
- RSI
- Gann
- ADXR
- Stochastics
- Volume
- Triangles
- Futures
- Cycles
- Volatility
- ZIGZAG
- MESA
- Retracement
- Aroon
INDICATORS LIST
LIST OF TOPICS
PRINT THIS ARTICLE
by Stella Osoba, CMT
The stock of XYL, the global water infrastructure company which was debuted on the New York Stock Exchange in 2011, has had a good few months. It reached a low of 31.54 on January 21, 2016 and has been in an uptrend since. It is currently making new all time highs. What does the chart say about the performance of this rather new addition to the S&P 500 index?
Position: N/A
Stella Osoba, CMT
Stella Osoba is a trader and financial writer. She is a frequent contributor to "Technical Analysis of Stocks and Commodities" magazine and "Traders.com Advantage" as well as other financial publications.
PRINT THIS ARTICLE
TECHNICAL ANALYSIS
Xylem, Inc. (XYL)
05/25/16 04:42:43 PMby Stella Osoba, CMT
The stock of XYL, the global water infrastructure company which was debuted on the New York Stock Exchange in 2011, has had a good few months. It reached a low of 31.54 on January 21, 2016 and has been in an uptrend since. It is currently making new all time highs. What does the chart say about the performance of this rather new addition to the S&P 500 index?
Position: N/A
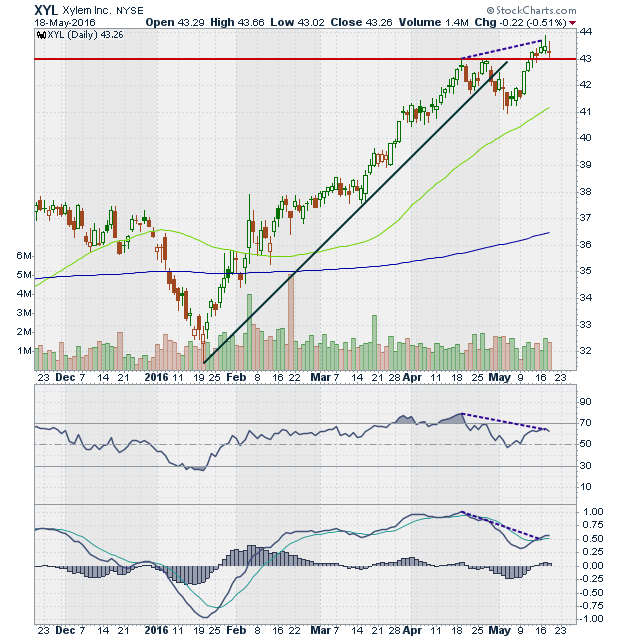
| On April 19, 2016, XYL soared to a high of 42.96. It tested this high successfully a week later and was able to rise to a high of 43.02 on April 26. A reaction took the stock price down to a low of 40.95 on May 4, 2016, but the rise off this low has brought the stock back up to a test of its April 19, 2016 highs. On May 12, 2016, XYL pushed through resistance to close at its all time high of 43.27. The next day, the 13th, saw a rise to a high of 43.41, but it was unable to hold onto the high and gave back some of the gains to close below the previous days close at 43.15. |
|
| Figure 1. Daily chart for XYL, Inc. |
| Graphic provided by: StockCharts.com. |
| |
| On May 16 and May 17 price succeeded in reaching new highs of 43.69 and 43.87 respectively. But on both days the closes were at the lower half of the range and the candles had long upper tails. May 18, 2016 saw price retreat slightly from previous highs, and it formed a doji and used the former resistance line as support. |
| With both the MACD and the RSI showing negative divergence could the recent rise to new highs be a fake out? Might a reaction be pending? |
| When a chart is in what appears to be a healthy uptrend, it is always wise to study the chart to look for unusual behavior which can hint at signs of impending trouble. The candles with overlapping bodies between May 12 and May 16, with long upper tails and the negative divergence, all point to a loss of momentum and possible trouble in the short term for the stock. If in a long position, hold, but do not initiate new longs until the situation is clearer. |
Stella Osoba is a trader and financial writer. She is a frequent contributor to "Technical Analysis of Stocks and Commodities" magazine and "Traders.com Advantage" as well as other financial publications.
| E-mail address: | stellaosoba@gmail.com |
Click here for more information about our publications!
PRINT THIS ARTICLE

Request Information From Our Sponsors
- StockCharts.com, Inc.
- Candle Patterns
- Candlestick Charting Explained
- Intermarket Technical Analysis
- John Murphy on Chart Analysis
- John Murphy's Chart Pattern Recognition
- John Murphy's Market Message
- MurphyExplainsMarketAnalysis-Intermarket Analysis
- MurphyExplainsMarketAnalysis-Visual Analysis
- StockCharts.com
- Technical Analysis of the Financial Markets
- The Visual Investor
- VectorVest, Inc.
- Executive Premier Workshop
- One-Day Options Course
- OptionsPro
- Retirement Income Workshop
- Sure-Fire Trading Systems (VectorVest, Inc.)
- Trading as a Business Workshop
- VectorVest 7 EOD
- VectorVest 7 RealTime/IntraDay
- VectorVest AutoTester
- VectorVest Educational Services
- VectorVest OnLine
- VectorVest Options Analyzer
- VectorVest ProGraphics v6.0
- VectorVest ProTrader 7
- VectorVest RealTime Derby Tool
- VectorVest Simulator
- VectorVest Variator
- VectorVest Watchdog