HOT TOPICS LIST
- MACD
- Fibonacci
- RSI
- Gann
- ADXR
- Stochastics
- Volume
- Triangles
- Futures
- Cycles
- Volatility
- ZIGZAG
- MESA
- Retracement
- Aroon
INDICATORS LIST
LIST OF TOPICS
PRINT THIS ARTICLE
by Koos van der Merwe
'SELL in MAY and GO AWAY' is a maxim that is always on every investor's mind.
Position: Sell
Koos van der Merwe
Has been a technical analyst since 1969, and has worked as a futures and options trader with First Financial Futures in Johannesburg, South Africa.
PRINT THIS ARTICLE
TECHNICAL ANALYSIS
Sell In May And Go Away
05/25/16 01:55:35 PMby Koos van der Merwe
'SELL in MAY and GO AWAY' is a maxim that is always on every investor's mind.
Position: Sell
| Historically, the market has weaker returns in the period from May to October. Over the past 20 years, the S&P averaged gains of only 0.85%, even though it was positive 60% of the time. Why do investors move out of the market over this period? I believe it is because of the school holidays. When on holiday with the family, traders do not want to worry about the stock market, so, move to cash, and return to trading around Halloween, when Summer starts moving into Fall; when children return to school and the Summer holiday season is over. Will the Sell in May maxim be in force this year? One must remember that it does not happen every year. Last year, 2016, during May the S&P500 Index hit an all-time high. This year, with the U.K. voting on whether to leave the European Union; with the Presidential campaign in the USA capturing everyone's attention, especially with the Republican hierarchy indecisive about supporting Donald Trump as their representative; and with the uncertainty about whether Janet Yellen of the Federal Reserve will increase interest rates or not, taking a four month leave of absence from the market may be the way to go. |

|
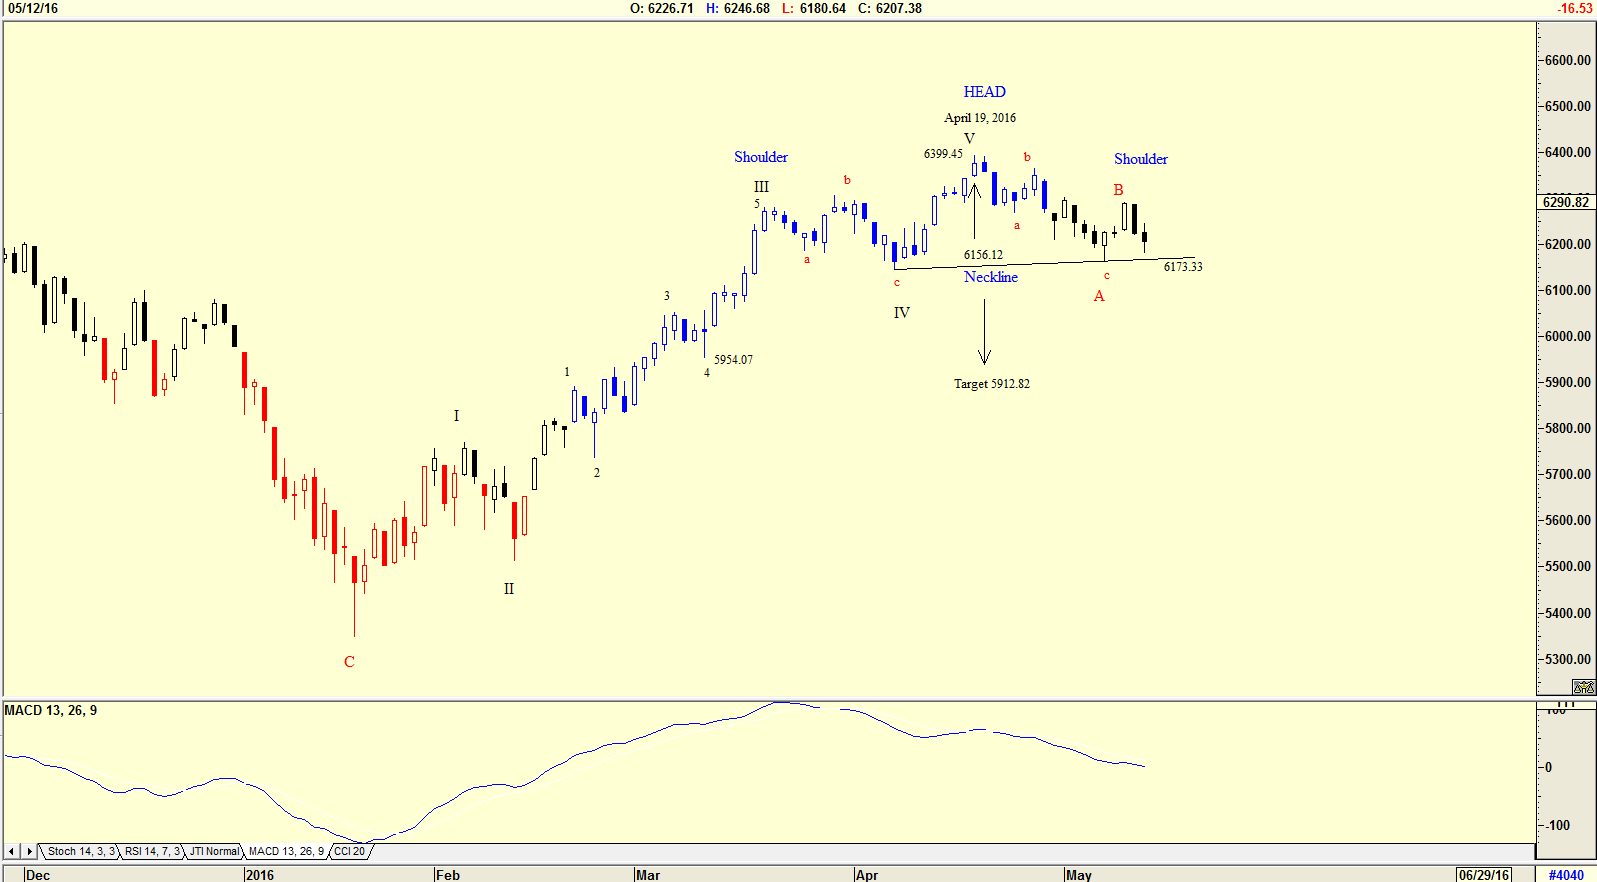
| Figure 1. Daily chart of the NYSE Composite Index. |
| Graphic provided by: AdvancedGET. |
| |
| The chart in Figure 1 is a daily chart of the NYSE Composite Index (COMP). The chart shows an Elliott wave count showing that a WAVE V top was reached on April 19th 2016. And that the market is now moving down in an ABC correction. The chart does suggest that the B-Wave up is complete, but this will only be confirmed when the index breaks below the Head and Shoulders neckline at 6173.33. Should the Head and Shoulders pattern appear, then the index could drop to 5912.82 (3699.45-6156.13=243.31. 6156.13-243.31=5912.82). This figure is below the low of 5954.07, the low suggested by the 4th Wave of lesser degree; the target suggested by the Elliott wave strategy for a correction. One should therefore keep both targets in mind, should a C-WAVE correction occur. Do note that the MACD indicator is trending down, suggesting that this is indeed possible. |

|
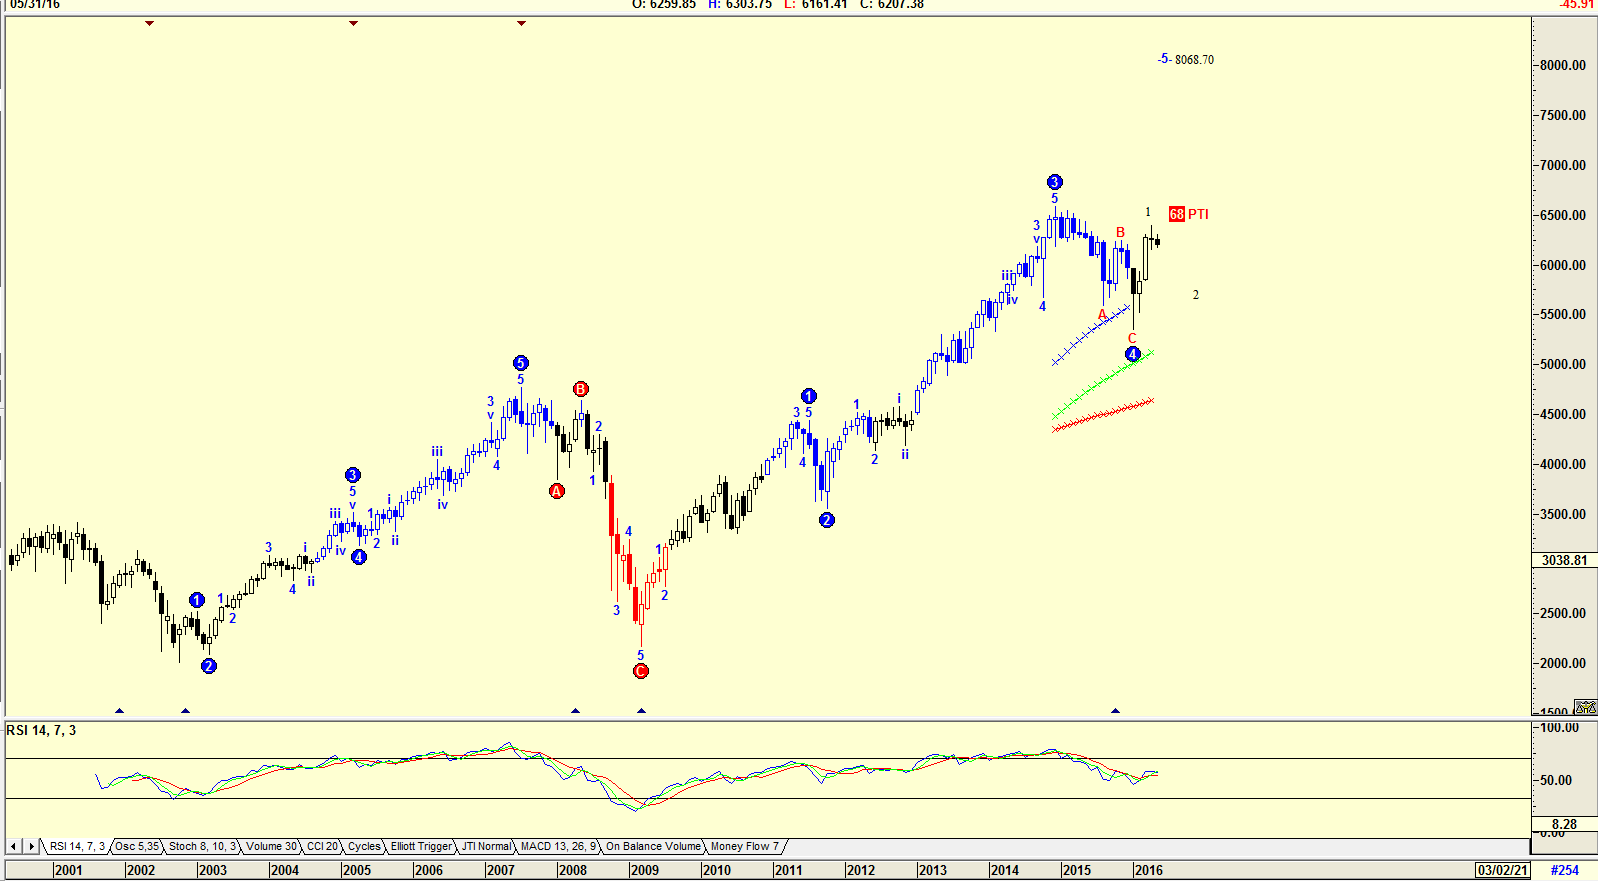
| Figure 2. Monthly chart of the NYSE Composite Index. |
| Graphic provided by: AdvancedGET. |
| |
| The chart in Figure 2 is a monthly chart of the NYSE Composite Index with an Elliott wave count suggesting that the index is in an Elliott Wave 5 with a target of 8068.70. The PTI (Probability Index) is 68, suggesting that there is a 68% chance that this could occur. However, the RSI index is still trending down, suggesting that the index could have completed a wave 1 of WAVE 5, and could now be falling in a wave 2 of WAVE 5. This could last 4 to 5 months, the time period suggested by the 'Sell in May and Go Away' maxim. With all the uncertainty in the world and the United States occurring at the moment, uncertainty that could affect trading and investment decisions, one other maxim comes to mind, namely, 'When in Doubt, Stay Out.' The 'Sell in May and Go Away' could therefore definitely occur this year. Caution therefore prevails. |
Has been a technical analyst since 1969, and has worked as a futures and options trader with First Financial Futures in Johannesburg, South Africa.
| Address: | 3256 West 24th Ave |
| Vancouver, BC | |
| Phone # for sales: | 6042634214 |
| E-mail address: | petroosp@gmail.com |
Click here for more information about our publications!
PRINT THIS ARTICLE

Request Information From Our Sponsors
- StockCharts.com, Inc.
- Candle Patterns
- Candlestick Charting Explained
- Intermarket Technical Analysis
- John Murphy on Chart Analysis
- John Murphy's Chart Pattern Recognition
- John Murphy's Market Message
- MurphyExplainsMarketAnalysis-Intermarket Analysis
- MurphyExplainsMarketAnalysis-Visual Analysis
- StockCharts.com
- Technical Analysis of the Financial Markets
- The Visual Investor
- VectorVest, Inc.
- Executive Premier Workshop
- One-Day Options Course
- OptionsPro
- Retirement Income Workshop
- Sure-Fire Trading Systems (VectorVest, Inc.)
- Trading as a Business Workshop
- VectorVest 7 EOD
- VectorVest 7 RealTime/IntraDay
- VectorVest AutoTester
- VectorVest Educational Services
- VectorVest OnLine
- VectorVest Options Analyzer
- VectorVest ProGraphics v6.0
- VectorVest ProTrader 7
- VectorVest RealTime Derby Tool
- VectorVest Simulator
- VectorVest Variator
- VectorVest Watchdog
