HOT TOPICS LIST
- MACD
- Fibonacci
- RSI
- Gann
- ADXR
- Stochastics
- Volume
- Triangles
- Futures
- Cycles
- Volatility
- ZIGZAG
- MESA
- Retracement
- Aroon
INDICATORS LIST
LIST OF TOPICS
PRINT THIS ARTICLE
by Koos van der Merwe
This past week has been an interesting week, both in the political agenda and in the share market of the USA.
Position: Accumulate
Koos van der Merwe
Has been a technical analyst since 1969, and has worked as a futures and options trader with First Financial Futures in Johannesburg, South Africa.
PRINT THIS ARTICLE
TECHNICAL ANALYSIS
A Few Shares To Watch
05/18/16 04:02:53 PMby Koos van der Merwe
This past week has been an interesting week, both in the political agenda and in the share market of the USA.
Position: Accumulate
| The Dow Jones dropped in the past week. With the American Presidential race appearing to settle as a fight between Hillary Clinton and Donald Trump, one wonders if this was not the reason for the drop. Whatever the negativity there are always shares that should be watched for possible future buys, especially shares owned by Warren Buffett. Warren Buffett is probably the most successful investor in the world. His quote, "It's far better to buy a wonderful company at a fair price than a fair company at a wonderful price," is something one should follow, especially when the market corrects. Below is a look at three of the companies he owns. |

|
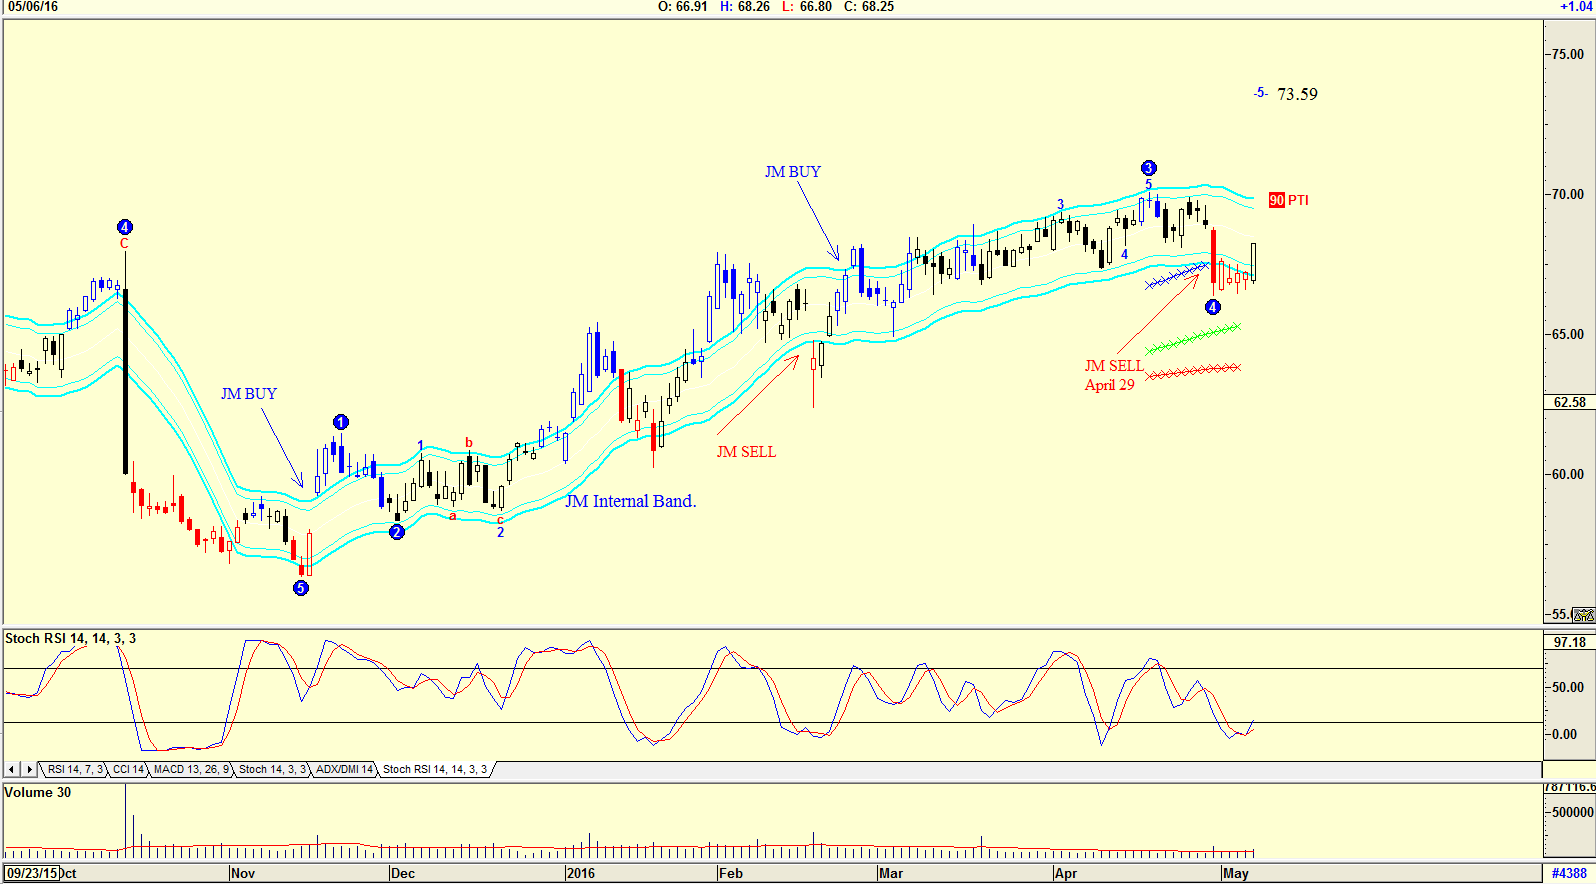
| Figure 1. Daily chart of Walmart. |
| Graphic provided by: AdvancedGET. |
| |
| The chart in Figure 1 is a daily chart of Walmart Stores, a share Warren Buffett owns. The chart shows an Elliott wave count suggesting that the price should start rising in a wave 5 with a target of $73.59. The PTI (Probability Index) is 90, which is very high. The share price did give a JM Internal Band sell signal on April 29th, and moved sideways, rising strongly on May 6th but not yet suggesting a JM Internal Band buy. The JM Internal Band is a 15 period simple moving average offset by 2% positive and 2% negative. A move above the upper band suggests a buy, and below the lower band, a sell. Do note the Stochastic RSI indicator, which is suggesting a buy. Volume has broken above the read average line and with a rising price and rising volume, a buy signal is confirmed. |

|
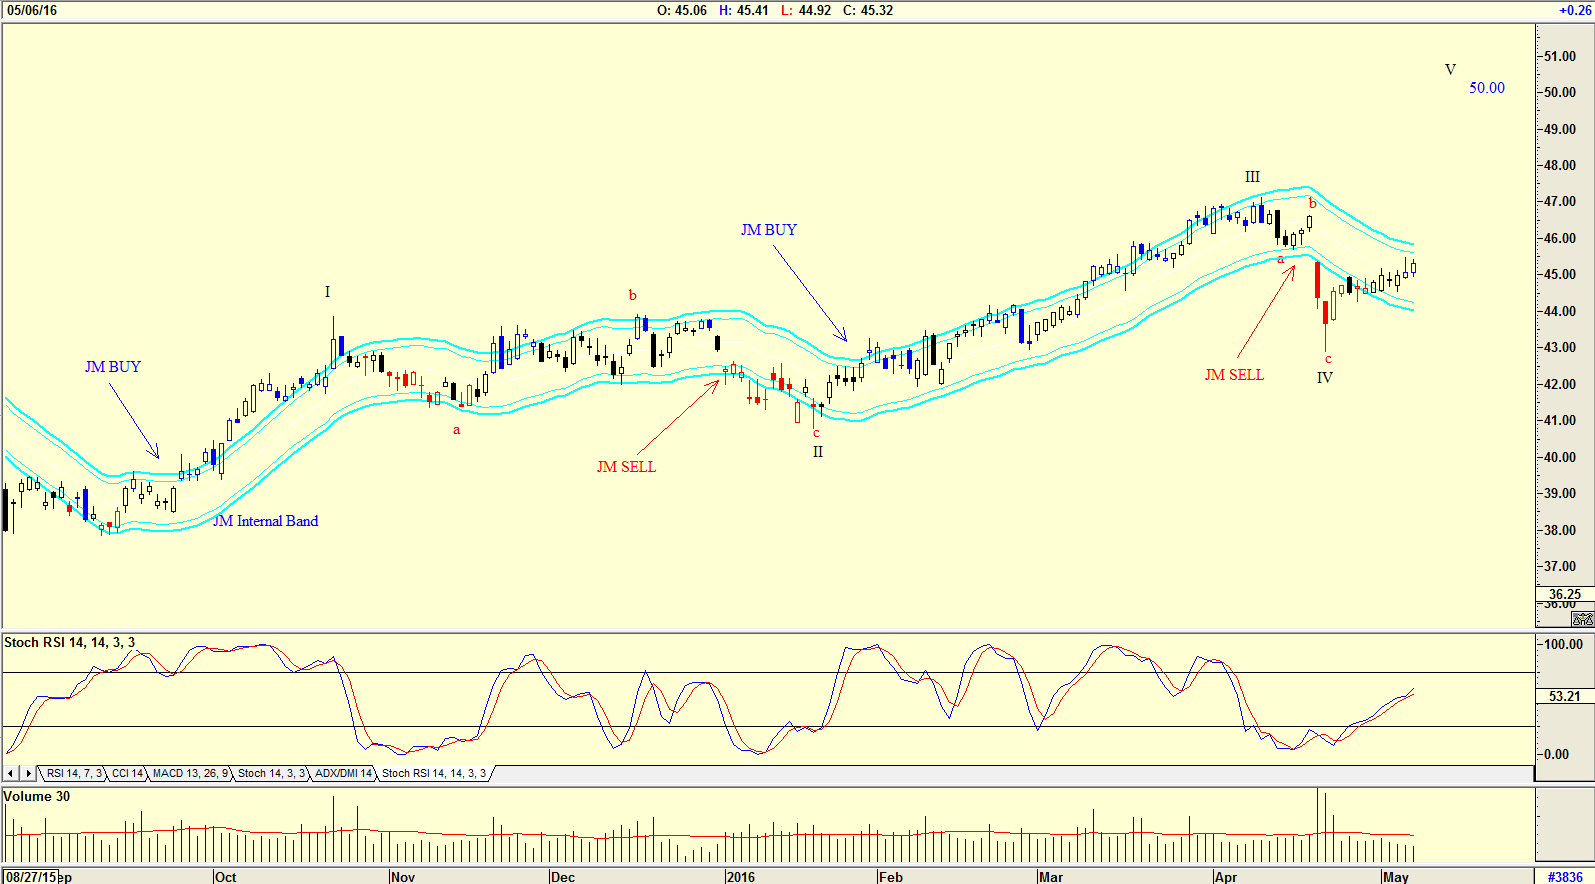
| Figure 2. Daily chart of Coca-Cola. |
| Graphic provided by: AdvancedGET. |
| |
| The chart in Figure 2 is a daily chart of Coca-Cola with the Elliott wave count suggesting that the share price should rise in a WAVE V to approximately the $50 mark. The Stochastic RSI is trending upward, but volume is weak as the share price rises, suggesting weakness. A rising share price on rising volume suggests strength. A rising share price on falling volume suggests weakness. Should the share price rise above the upper JM Internal band, a conservative buy signal will be confirmed. |

|
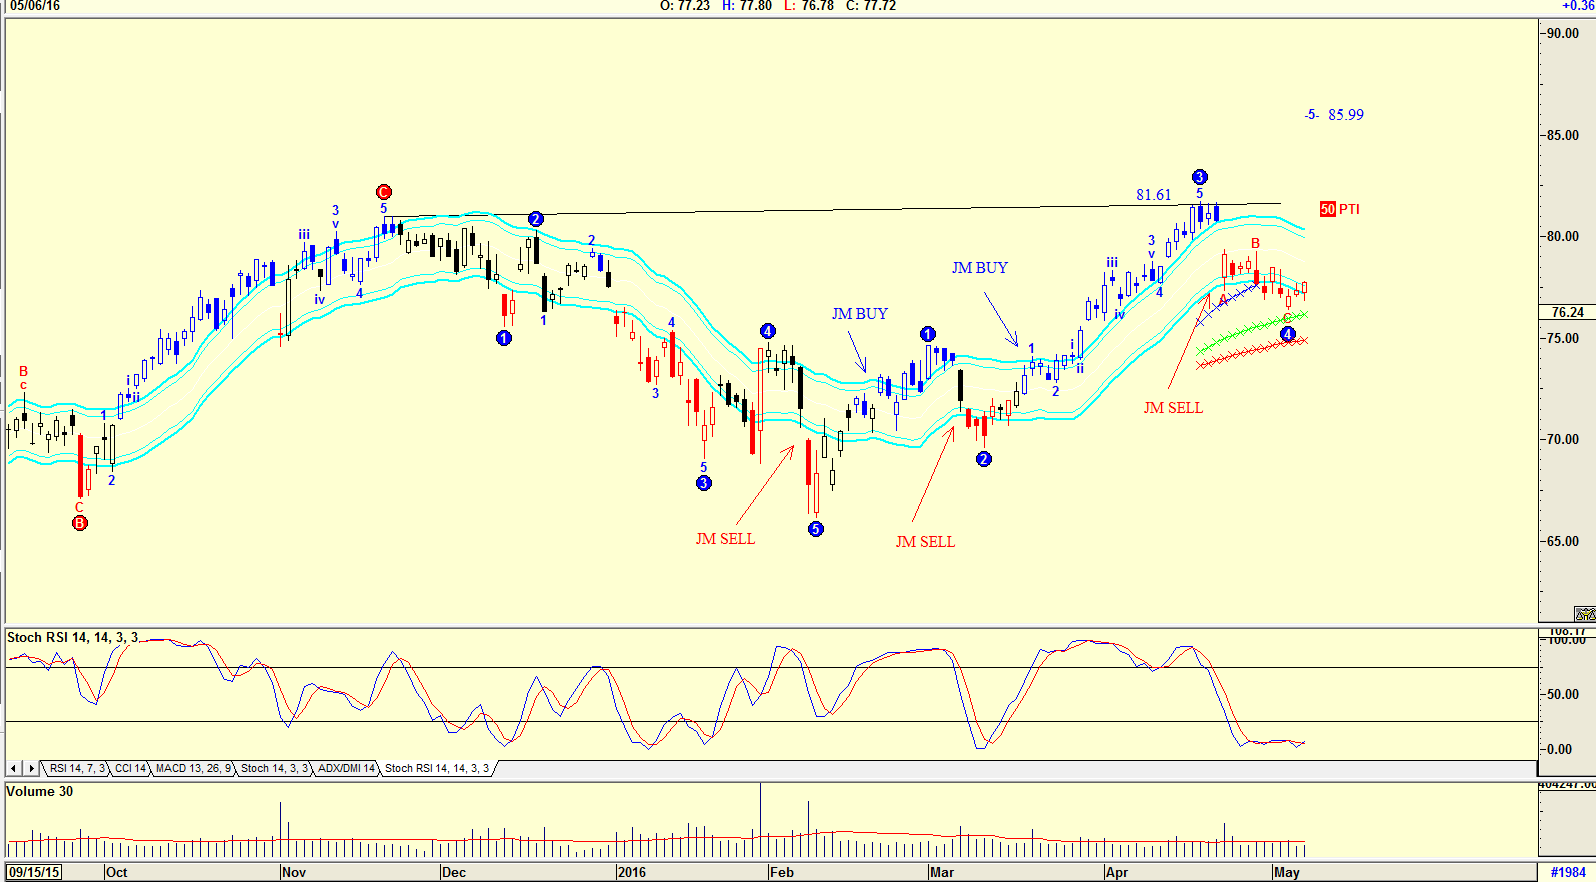
| Figure 3. Daily chart of VISA. |
| Graphic provided by: AdvancedGET. |
| |
| The chart in Figure 3 is a chart of VISA. The chart shows an Elliott wave count once again suggesting that a WAVE 4 has been completed, and that the share price should start rising in a WAVE 5 to a target of 85.99. The PTI is 50, suggesting that the probability of reaching this target is 50%. The resistance line is suggesting a resistance level at $81.61. Do note the Stochastic RSI indicator is oversold but has not given a buy signal. Volume is also below average. The chart prices a red, triggered by the XTL (eXpert Trend Locator) offered by the Advanced GET program. The indicator uses statistical evaluation of the market to tell the difference between random market swings (noise) and directed market swings (trends). When a share price is blue, the trend is up; red the trend is down; and black the trend is neutral. There are many more shares that Warren Buffett owns, and each should be looked at as protective stocks in a down trending market. Is Warren Buffett always right? No, but over the long term his successful buy-and-hold strategy has proved very successful. My suggestion is to always search for a list of shares he owns, and then to watch them on a chart looking for the correct time to buy them. His fundamental analysis always says, "Buy me, I am safe." Technical analysis however tells you when to buy them. |
Has been a technical analyst since 1969, and has worked as a futures and options trader with First Financial Futures in Johannesburg, South Africa.
| Address: | 3256 West 24th Ave |
| Vancouver, BC | |
| Phone # for sales: | 6042634214 |
| E-mail address: | petroosp@gmail.com |
Click here for more information about our publications!
PRINT THIS ARTICLE

|

Request Information From Our Sponsors
- StockCharts.com, Inc.
- Candle Patterns
- Candlestick Charting Explained
- Intermarket Technical Analysis
- John Murphy on Chart Analysis
- John Murphy's Chart Pattern Recognition
- John Murphy's Market Message
- MurphyExplainsMarketAnalysis-Intermarket Analysis
- MurphyExplainsMarketAnalysis-Visual Analysis
- StockCharts.com
- Technical Analysis of the Financial Markets
- The Visual Investor
- VectorVest, Inc.
- Executive Premier Workshop
- One-Day Options Course
- OptionsPro
- Retirement Income Workshop
- Sure-Fire Trading Systems (VectorVest, Inc.)
- Trading as a Business Workshop
- VectorVest 7 EOD
- VectorVest 7 RealTime/IntraDay
- VectorVest AutoTester
- VectorVest Educational Services
- VectorVest OnLine
- VectorVest Options Analyzer
- VectorVest ProGraphics v6.0
- VectorVest ProTrader 7
- VectorVest RealTime Derby Tool
- VectorVest Simulator
- VectorVest Variator
- VectorVest Watchdog
