

HOT TOPICS LIST
- MACD
- Fibonacci
- RSI
- Gann
- ADXR
- Stochastics
- Volume
- Triangles
- Futures
- Cycles
- Volatility
- ZIGZAG
- MESA
- Retracement
- Aroon
INDICATORS LIST
LIST OF TOPICS
PRINT THIS ARTICLE
by Stella Osoba, CMT
With Whole Foods Market (WFM) set to announce quarterly earnings on Wednesday May 4th, 2016, what does the chart say about the performance of its stock?
Position: N/A
Stella Osoba, CMT
Stella Osoba is a trader and financial writer. She is a frequent contributor to "Technical Analysis of Stocks and Commodities" magazine and "Traders.com Advantage" as well as other financial publications.
PRINT THIS ARTICLE
TECHNICAL ANALYSIS
Sometimes It's Best To Stand Aside And Wait
05/18/16 03:55:36 PMby Stella Osoba, CMT
With Whole Foods Market (WFM) set to announce quarterly earnings on Wednesday May 4th, 2016, what does the chart say about the performance of its stock?
Position: N/A
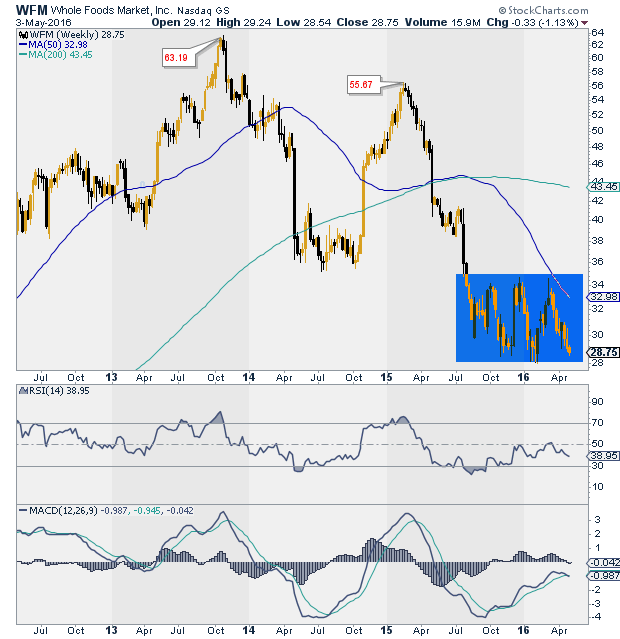
| Shares of the natural and organic foods supermarket chain have been underperforming since topping at $63.53 on October 28, 2013. A lengthy downtrend ensued, followed by a lower high on February 19, 2015, when the stock topped at $56.51. The stock closed at $28.75 on May 3, 2016 for a 55% decline from its high in October 2013. The chart has looked increasingly bearish with price making lower lows for extended periods and alternatively locked in trading ranges (see Figure 1). |
|
| Figure 1. Weekly chart for WFM. |
| Graphic provided by: StockCharts.com. |
| |
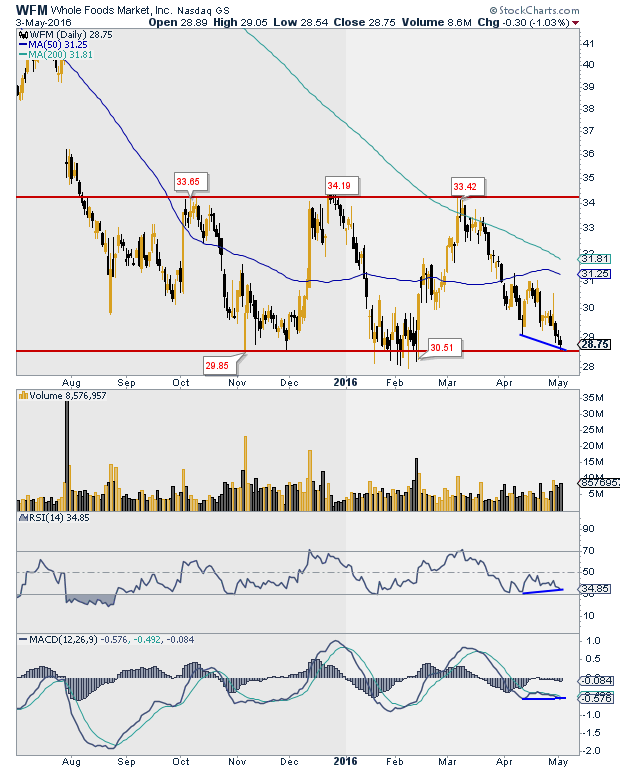
| Short term swing traders could have traded the swings and made a few points in each direction as the swings were rather clearly delineated (see Figure 2). With WFM trading at the bottom of its range on May 3, 2016, would this be a good time to get on board for a swing trade back to the top of the range? |
|
| Figure 2. Daily chart for WFM. |
| Graphic provided by: StockCharts.com. |
| |
| A look at the MACD histogram shows that it is creeping away from the zero line and closed at -0.084. The downward momentum seems to have slowed, for while price is making lower lows, the MACD is not. The RSI also appears to be slightly more bullish for the stock with its higher low. But the unknown is the earnings figures which are set to be announced after the close of the market on May 4, 2016. |
| Markets anticipate the news, but they are not necessarily the news. A surprise earnings announcement would be bullish or bearish for the stock, depending on the nature of the surprise. This unknown could change the look of the chart instantly. A missed earnings report could push the price below the low of the range and might result in the stock continuing its downtrend with another leg down. A report with a better than anticipated earnings surprise could do the opposite and might even force the stock up and out of its trading range. |
| With these unknowns potentially so crucial for the performance of the stock, it is best to wait until the market digests the earnings report and it is properly reflected in the chart to jump on board. Do not be tempted to guess what earnings will look like. A stock locked in a trading range means neither the bulls nor the bears have control. So it is best to stand aside until the picture becomes clear. |
Stella Osoba is a trader and financial writer. She is a frequent contributor to "Technical Analysis of Stocks and Commodities" magazine and "Traders.com Advantage" as well as other financial publications.
| E-mail address: | stellaosoba@gmail.com |
Click here for more information about our publications!
Comments
Date:�05/20/16Rank:�4Comment:�Clear writing that you can apply very well to trading the stock.
Thanks, Claudio

Request Information From Our Sponsors
- StockCharts.com, Inc.
- Candle Patterns
- Candlestick Charting Explained
- Intermarket Technical Analysis
- John Murphy on Chart Analysis
- John Murphy's Chart Pattern Recognition
- John Murphy's Market Message
- MurphyExplainsMarketAnalysis-Intermarket Analysis
- MurphyExplainsMarketAnalysis-Visual Analysis
- StockCharts.com
- Technical Analysis of the Financial Markets
- The Visual Investor
- VectorVest, Inc.
- Executive Premier Workshop
- One-Day Options Course
- OptionsPro
- Retirement Income Workshop
- Sure-Fire Trading Systems (VectorVest, Inc.)
- Trading as a Business Workshop
- VectorVest 7 EOD
- VectorVest 7 RealTime/IntraDay
- VectorVest AutoTester
- VectorVest Educational Services
- VectorVest OnLine
- VectorVest Options Analyzer
- VectorVest ProGraphics v6.0
- VectorVest ProTrader 7
- VectorVest RealTime Derby Tool
- VectorVest Simulator
- VectorVest Variator
- VectorVest Watchdog