HOT TOPICS LIST
- MACD
- Fibonacci
- RSI
- Gann
- ADXR
- Stochastics
- Volume
- Triangles
- Futures
- Cycles
- Volatility
- ZIGZAG
- MESA
- Retracement
- Aroon
INDICATORS LIST
LIST OF TOPICS
PRINT THIS ARTICLE
by Stella Osoba, CMT
Shares of Twitter (TWTR) closed on May 2, 2016 near support after several days of heavy selling. Is it now time to give the shares a second look for a possible long play?
Position: N/A
Stella Osoba, CMT
Stella Osoba is a trader and financial writer. She is a frequent contributor to "Technical Analysis of Stocks and Commodities" magazine and "Traders.com Advantage" as well as other financial publications.
PRINT THIS ARTICLE
TECHNICAL ANALYSIS
With Shares Of Twitter Nearing Support Is It Time To Give It A Second Look?
05/10/16 03:36:07 PMby Stella Osoba, CMT
Shares of Twitter (TWTR) closed on May 2, 2016 near support after several days of heavy selling. Is it now time to give the shares a second look for a possible long play?
Position: N/A
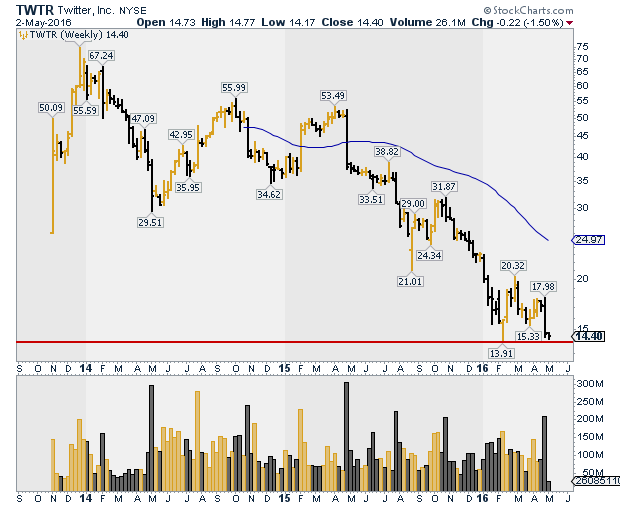
| The TWTR IPO on November 3, 2013 was termed a "clean" debut, which at the time, contrasted sharply with Facebook's (FB) "messy" debut. TWTR's stock debuted at $26 a share. On that day price soared to a high of $50.09 and closed at $41.65. Over the next few weeks, the share price of TWTR soared, reaching an ultimate high on December 23rd, 2013 of $74.73, or almost tripling in price. However, for the time being, that is where the good news ended for the behavior of TWTR's share price. |

|
| Figure 1. Weekly chart of Twitter, Inc. (TWTR). |
| Graphic provided by: StockCharts.com. |
| |
| Figure 1 is the weekly chart of TWTR since its debut. At a glance we can see the stocks declining fortunes. TWTR has been in a downtrend since it closed at $74.73 on December 26, 2013. |

|
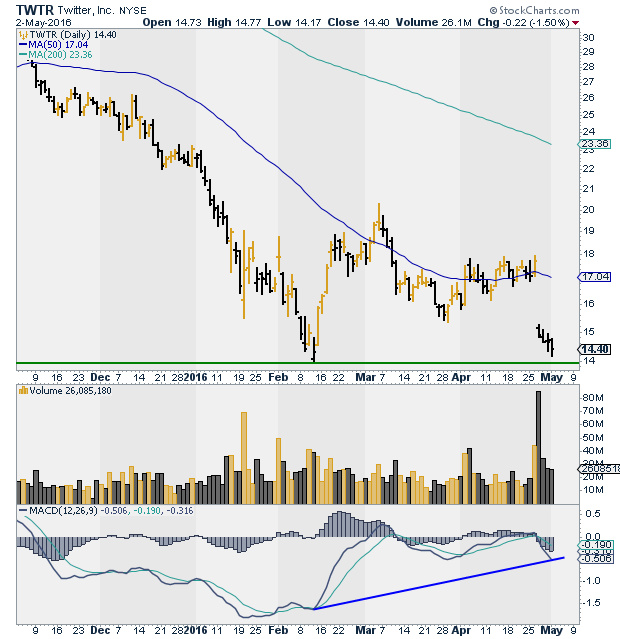
| Figure 2. Daily chart of Twitter, Inc. (TWTR). |
| Graphic provided by: StockCharts.com. |
| |
| Figure 2 shows the daily chart of TWTR. TWTR reported quarterly earnings on April 26, 2016 which fell below analysts estimates and the stock took a further beating, gapping down on heavy volume. TWTR's price is now close to it's previous all time low of $13.91, which was reached on February 11, 2016. On May 2, 2016, the stock's low was $14.17. It closed at $14.40. |
| TWTR's chart shows that price is still obviously in a downtrend. So the question now is what will price do at support? Will it slice through its previous lows to new lows or will the test of its of February 11, 2016 low be successful? |
| One clue might be the behavior of the MACD. Even though the MACD is below 0 and the signal line is above the MACD line, which are bearish signs, a line drawn from the February 11, 2016 low to the May 2, 2016 low (see Figure 2), shows the MACD making higher lows than price which could be a bullish sign. Before acting on signals from indicators, however, wait for price to confirm. So price would have to have a successful test of support and give confirmation. The trend of TWTR is still down until price acts otherwise. But keeping a sharp eye now on how the stock behaves as it approaches this crucial support level can give an investor some important clues about the likely performance of the stock in the near future. |
Stella Osoba is a trader and financial writer. She is a frequent contributor to "Technical Analysis of Stocks and Commodities" magazine and "Traders.com Advantage" as well as other financial publications.
| E-mail address: | stellaosoba@gmail.com |
Click here for more information about our publications!
PRINT THIS ARTICLE

|

Request Information From Our Sponsors
- StockCharts.com, Inc.
- Candle Patterns
- Candlestick Charting Explained
- Intermarket Technical Analysis
- John Murphy on Chart Analysis
- John Murphy's Chart Pattern Recognition
- John Murphy's Market Message
- MurphyExplainsMarketAnalysis-Intermarket Analysis
- MurphyExplainsMarketAnalysis-Visual Analysis
- StockCharts.com
- Technical Analysis of the Financial Markets
- The Visual Investor
- VectorVest, Inc.
- Executive Premier Workshop
- One-Day Options Course
- OptionsPro
- Retirement Income Workshop
- Sure-Fire Trading Systems (VectorVest, Inc.)
- Trading as a Business Workshop
- VectorVest 7 EOD
- VectorVest 7 RealTime/IntraDay
- VectorVest AutoTester
- VectorVest Educational Services
- VectorVest OnLine
- VectorVest Options Analyzer
- VectorVest ProGraphics v6.0
- VectorVest ProTrader 7
- VectorVest RealTime Derby Tool
- VectorVest Simulator
- VectorVest Variator
- VectorVest Watchdog
