HOT TOPICS LIST
- MACD
- Fibonacci
- RSI
- Gann
- ADXR
- Stochastics
- Volume
- Triangles
- Futures
- Cycles
- Volatility
- ZIGZAG
- MESA
- Retracement
- Aroon
INDICATORS LIST
LIST OF TOPICS
PRINT THIS ARTICLE
by Koos van der Merwe
With the market correcting heavily recently, should you keep an eye on shares that could be a solid future investment?
Position: Sell
Koos van der Merwe
Has been a technical analyst since 1969, and has worked as a futures and options trader with First Financial Futures in Johannesburg, South Africa.
PRINT THIS ARTICLE
RSI
Going With The Indicators
05/04/16 04:00:36 PMby Koos van der Merwe
With the market correcting heavily recently, should you keep an eye on shares that could be a solid future investment?
Position: Sell
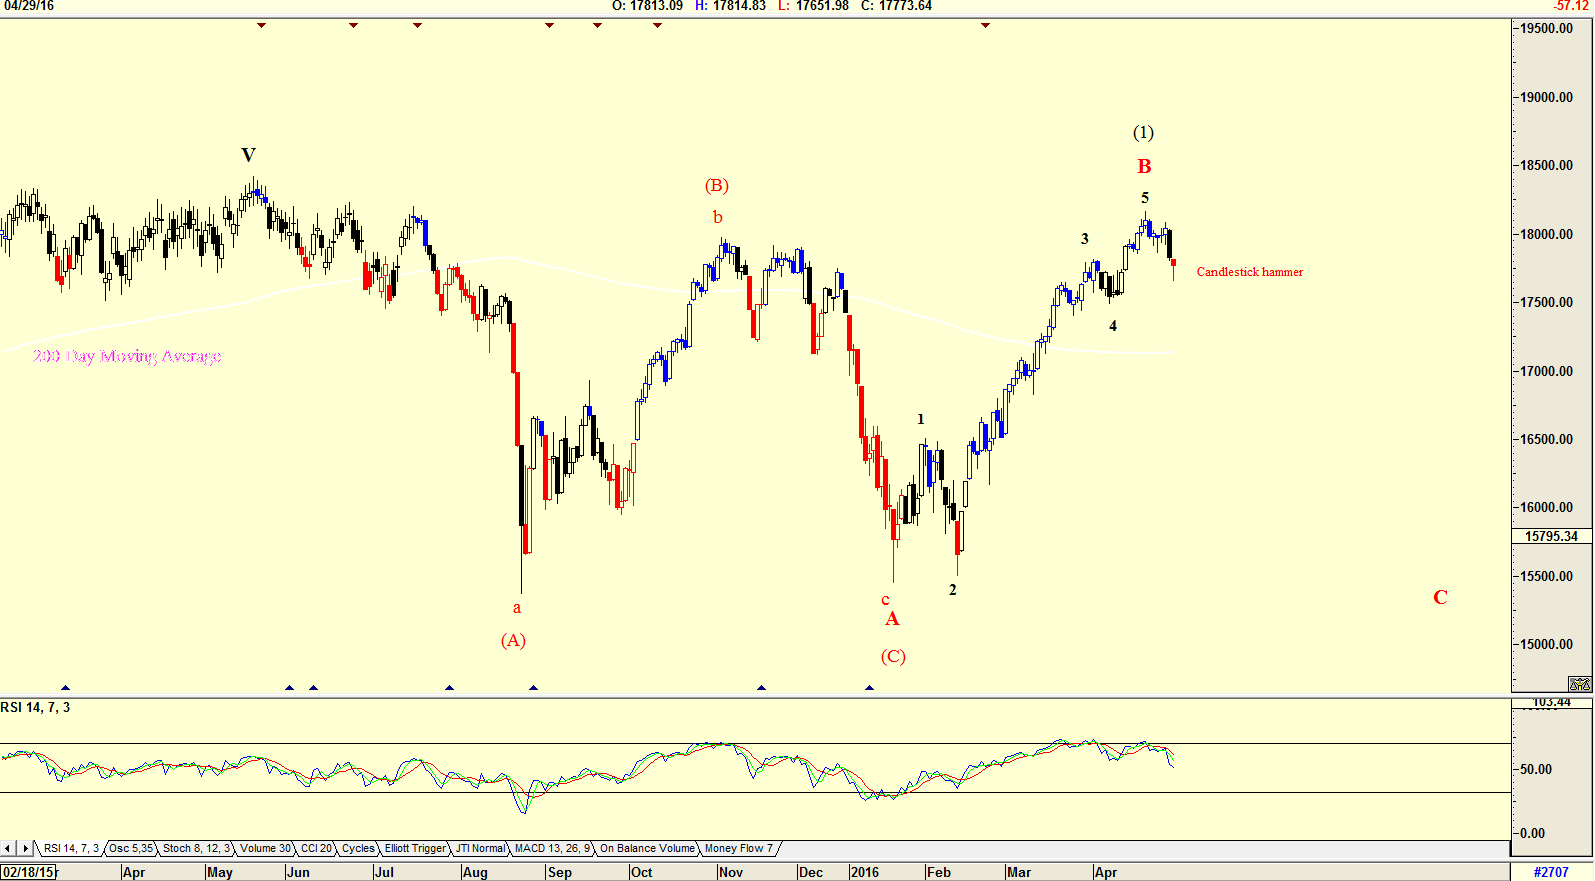
| The chart in Figure 1 is a daily chart of the Dow Jones with an Elliott wave count suggesting that the Dow could have completed a WAVE B and could have started falling in a WAVE C. Of course we know that the Elliott wave theory has become a signpost in the wilderness, and can change its count a little ways down the road. This is because computers are more and more taking over the trading and investing in the market, and computers do not have emotions. So the question of course is, is this truly a WAVE B with a major WAVE C correction in the offing, or is this a WAVE (1), an alternate count shown in brackets? Either way, a correction down is on the cards, whether it is a MAJOR WAVE C or the alternate WAVE (2) count, only time will tell. However, as a guide, do note the RSI (14) indicator which is suggesting continued weakness. Also note that the Dow should fall below the 200 day moving average before a correction up could occur. Do note the candlestick Hammer formation which is signalling a rally in the Dow. The rally could be short lived, however. |

|
| Figure 1. Dow Jones Daily. |
| Graphic provided by: AdvancedGET. |
| |
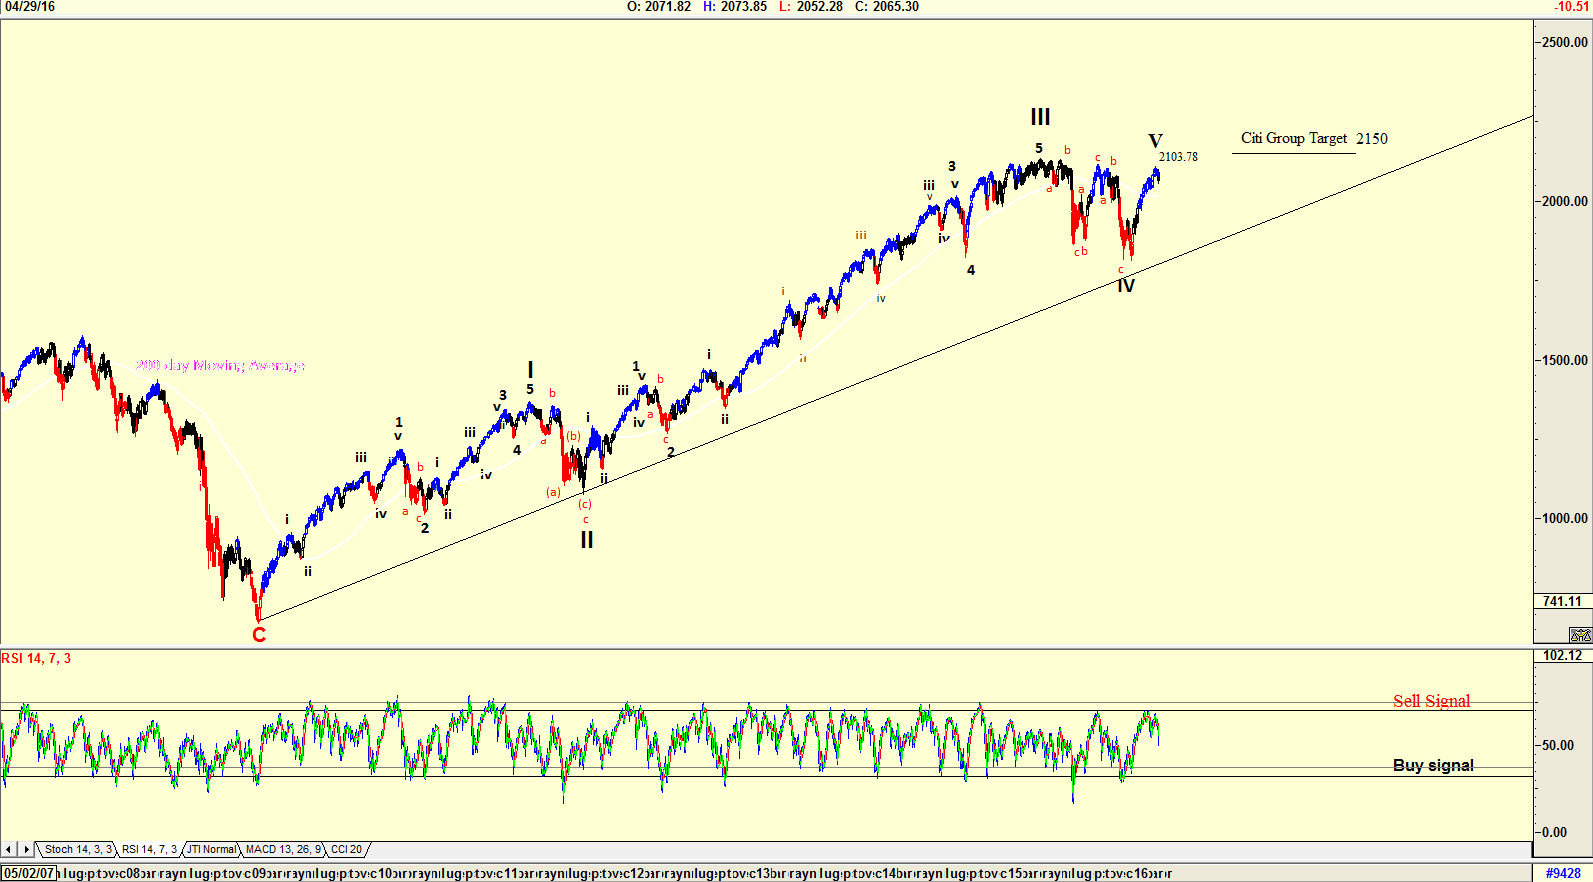
| The chart in Figure 2 is a daily chart of the S&P500 index with an Elliott wave count suggesting that a WAVE V at 2103.78 could be complete. However, do note the RSI indicator which has not reached overbought levels (Sell Signal), suggesting that the possibility of it rising to the target suggested by Citi Group is a possibility. |

|
| Figure 2. S&P 500 Index Daily. |
| Graphic provided by: AdvancedGET. |
| |
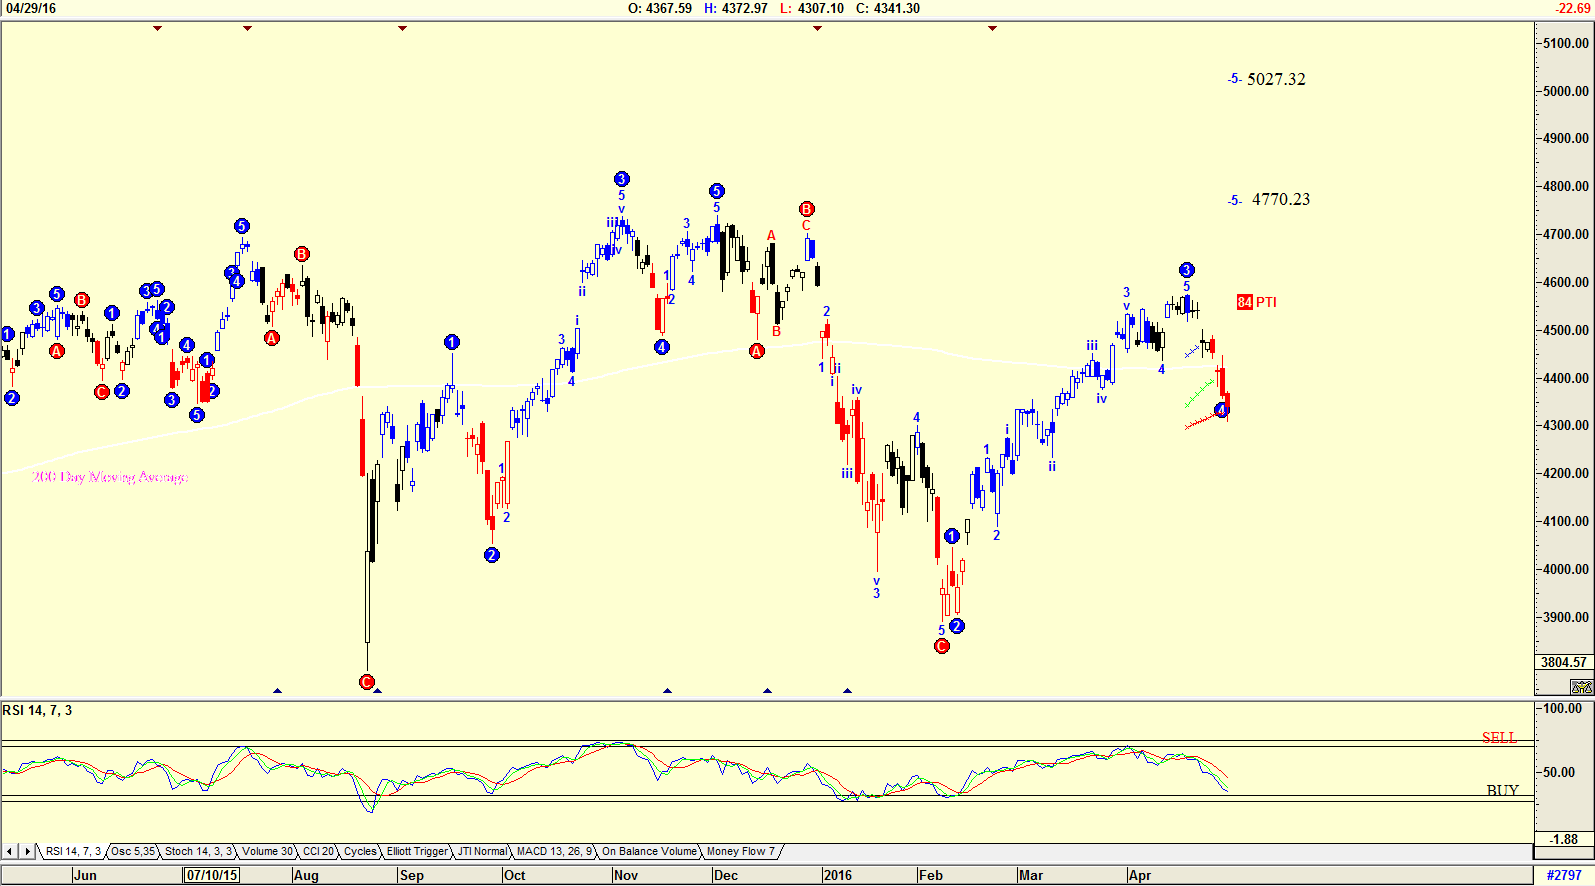
| The chart in Figure 3 is a chart of the Nasdaq index with an Elliott wave count suggesting that the Index should start rising in a WAVE 5 to either 4770.23 or 5027.32. The PTI (probability Index) is 84, suggesting that there is a strong 84% probability that this could indeed occur. The RSI indicator is not at oversold levels suggesting that further downside could occur, but do note that the indicator did not reach overbought levels before the index started correcting, although it did come pretty close. |

|
| Figure 3. Nasdaq Index Daily. |
| Graphic provided by: AdvancedGET. |
| |
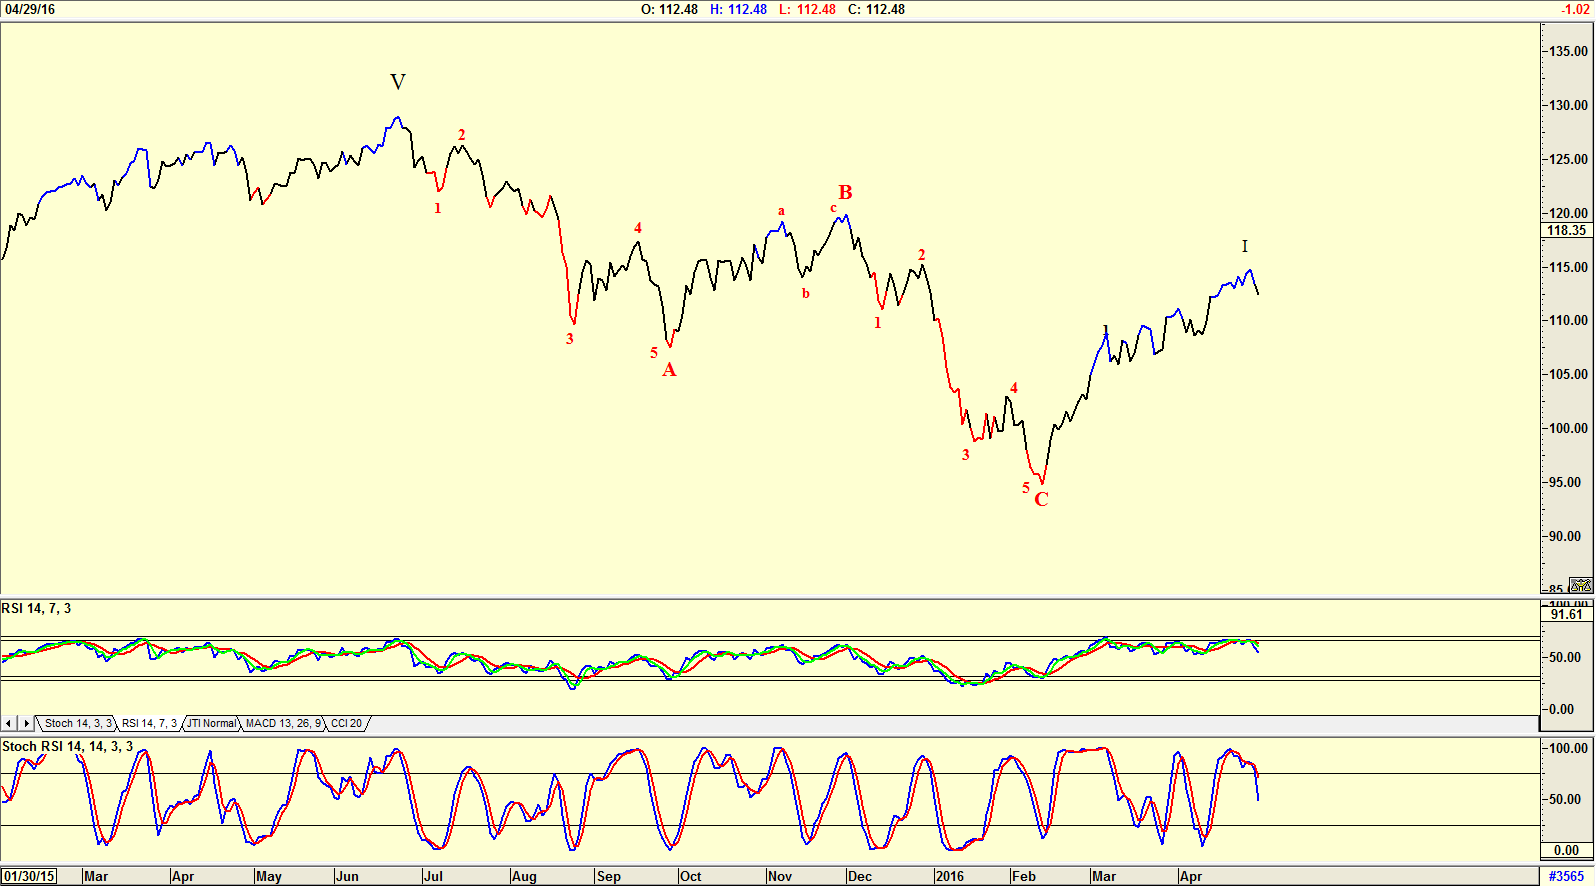
| Finally, do look at the chart of the RUSSELL 2000 index in Figure 4, which is suggesting a Wave 2 correction. Both the RSI indicator and the Stochastic RSI indicators are suggesting a correction in a Wave II. With the "Sell in May" maxim possibly starting early; with the indecisiveness occurring in the world because of WWIII; with the American Presidential election casting uncertainty with investors, caution is today the name of the game. Following what the indicators are telling us, whether they are right or wrong, is the way to go. Never forget that cash on hand is better than cash in the bush (uncertainty). Many investors are looking to GOLD to protect their cash, but there are also many stocks out there that should be closely watched, and bought for a long term hold. |

|
| Figure 4. Russell 2000 Index Daily. |
| Graphic provided by: AdvancedGET. |
| |
Has been a technical analyst since 1969, and has worked as a futures and options trader with First Financial Futures in Johannesburg, South Africa.
| Address: | 3256 West 24th Ave |
| Vancouver, BC | |
| Phone # for sales: | 6042634214 |
| E-mail address: | petroosp@gmail.com |
Click here for more information about our publications!
Comments
Date: 08/24/16Rank: 5Comment:

Request Information From Our Sponsors
- StockCharts.com, Inc.
- Candle Patterns
- Candlestick Charting Explained
- Intermarket Technical Analysis
- John Murphy on Chart Analysis
- John Murphy's Chart Pattern Recognition
- John Murphy's Market Message
- MurphyExplainsMarketAnalysis-Intermarket Analysis
- MurphyExplainsMarketAnalysis-Visual Analysis
- StockCharts.com
- Technical Analysis of the Financial Markets
- The Visual Investor
- VectorVest, Inc.
- Executive Premier Workshop
- One-Day Options Course
- OptionsPro
- Retirement Income Workshop
- Sure-Fire Trading Systems (VectorVest, Inc.)
- Trading as a Business Workshop
- VectorVest 7 EOD
- VectorVest 7 RealTime/IntraDay
- VectorVest AutoTester
- VectorVest Educational Services
- VectorVest OnLine
- VectorVest Options Analyzer
- VectorVest ProGraphics v6.0
- VectorVest ProTrader 7
- VectorVest RealTime Derby Tool
- VectorVest Simulator
- VectorVest Variator
- VectorVest Watchdog
