

HOT TOPICS LIST
- MACD
- Fibonacci
- RSI
- Gann
- ADXR
- Stochastics
- Volume
- Triangles
- Futures
- Cycles
- Volatility
- ZIGZAG
- MESA
- Retracement
- Aroon
INDICATORS LIST
LIST OF TOPICS
PRINT THIS ARTICLE
by Matt Blackman
Is the Nasdaq Composite Index (COMPQ) -and the tech sector- finally out of the woods or is it just another bear rally?
Position: N/A
Matt Blackman
Matt Blackman is a full-time technical and financial writer and trader. He produces corporate and financial newsletters, and assists clients in getting published in the mainstream media. He is the host of TradeSystemGuru.com. Matt has earned the Chartered Market Technician (CMT) designation. Find out what stocks and futures Matt is watching on Twitter at www.twitter.com/RatioTrade
PRINT THIS ARTICLE
HEAD & SHOULDERS
Nasdaq Composite Index - Is It Finally Shaking Off the Bears?
11/25/02 03:13:57 PMby Matt Blackman
Is the Nasdaq Composite Index (COMPQ) -and the tech sector- finally out of the woods or is it just another bear rally?
Position: N/A
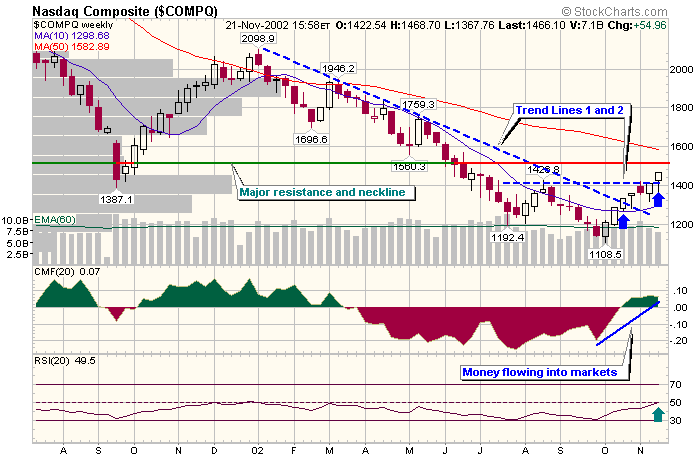
| Since hitting a high of 5,132 on March 6, 2000, the Nasdaq Composite Index has had a rough downhill ride. It hit a six-year low of 1,108 on October 10th and has since been marching higher. As discussed in "The Critical Head & Shoulders Test" (Working Money, November 12, 2002), a number of market indexes including the Nasdaq Composite have produced strong head & shoulders top patterns that, if confirmed and the resistance levels hold, do not bode well for the markets. |
| The head & shoulders neckline at 1,500 for the Nasdaq is now at hand and whether it can be decisively broken and become the new support line will reveal whether this tech rally has staying power or if it is just another short-lived bear rally. There are a number of factors that separate this rally from the last major one that occurred in the fall of 2001. First, a trendline that began in January 2002 (and had withstood five advances) was decisively broken on October 17 as the index gapped up. The 50-day simple moving average was also broken on the same day. Second, a double top trendline at 1,430 was broken on November 21. |
|
| Figure 1 � Weekly Nasdaq Composite Index showing broken trendlines 1 and 2 as well as the crucial resistance and neckline at 1,500. Note the relative strength index at 50 (green arrow). A break to the upside is believed to be a reliable longer-term buy signal by some traders. |
| Graphic provided by: StockCharts.com. |
| |
| The major resistance level and the head & shoulders neckline at 1,500 (red and green line) is the last hurdle that, when broken and held, will signal the failure of the head & shoulders pattern. This in turn will send a signal to the market technicians who follow chart patterns as to where the markets are heading from here. Why is this level so important? As any technical analyst will tell you, stock market performance is a leading economic indicator and a sustained break above this crucial resistance level will mean that the tech sector and economy is showing significant signs that better days lie ahead. It will also be a key test for the bears who will do their best to throw a scare into investors and keep the bear trend alive. Those who trade or invest in technology stocks or the Nasdaq 100 (QQQ - AMEX) will be watching this battle with baited breath. |
| Based on current market sentiment, the bulls have an edge. Whether they can maintain it will be the ultimate test. |
Matt Blackman is a full-time technical and financial writer and trader. He produces corporate and financial newsletters, and assists clients in getting published in the mainstream media. He is the host of TradeSystemGuru.com. Matt has earned the Chartered Market Technician (CMT) designation. Find out what stocks and futures Matt is watching on Twitter at www.twitter.com/RatioTrade
| Company: | TradeSystemGuru.com |
| Address: | Box 2589 |
| Garibaldi Highlands, BC Canada | |
| Phone # for sales: | 604-898-9069 |
| Fax: | 604-898-9069 |
| Website: | www.tradesystemguru.com |
| E-mail address: | indextradermb@gmail.com |
Traders' Resource Links | |
| TradeSystemGuru.com has not added any product or service information to TRADERS' RESOURCE. | |
Click here for more information about our publications!
Comments
Date:�11/26/02Rank:�5Comment:�
Date:�11/26/02Rank:�5Comment:�
Date:�11/27/02Rank:�2Comment:�
Date:�11/27/02Rank:�4Comment:�
Date:�12/08/02Rank:�4Comment:�
Date:�12/12/02Rank:�4Comment:�

Request Information From Our Sponsors
- StockCharts.com, Inc.
- Candle Patterns
- Candlestick Charting Explained
- Intermarket Technical Analysis
- John Murphy on Chart Analysis
- John Murphy's Chart Pattern Recognition
- John Murphy's Market Message
- MurphyExplainsMarketAnalysis-Intermarket Analysis
- MurphyExplainsMarketAnalysis-Visual Analysis
- StockCharts.com
- Technical Analysis of the Financial Markets
- The Visual Investor
- VectorVest, Inc.
- Executive Premier Workshop
- One-Day Options Course
- OptionsPro
- Retirement Income Workshop
- Sure-Fire Trading Systems (VectorVest, Inc.)
- Trading as a Business Workshop
- VectorVest 7 EOD
- VectorVest 7 RealTime/IntraDay
- VectorVest AutoTester
- VectorVest Educational Services
- VectorVest OnLine
- VectorVest Options Analyzer
- VectorVest ProGraphics v6.0
- VectorVest ProTrader 7
- VectorVest RealTime Derby Tool
- VectorVest Simulator
- VectorVest Variator
- VectorVest Watchdog