HOT TOPICS LIST
- MACD
- Fibonacci
- RSI
- Gann
- ADXR
- Stochastics
- Volume
- Triangles
- Futures
- Cycles
- Volatility
- ZIGZAG
- MESA
- Retracement
- Aroon
INDICATORS LIST
LIST OF TOPICS
PRINT THIS ARTICLE
by Billy Williams
IPOs often fail but PYPL may be the outlier to rise from the ashes as it prepares to breakout.
Position: Buy
Billy Williams
Billy Williams has been trading the markets for 27 years, specializing in momentum trading with stocks and options.
PRINT THIS ARTICLE
BREAKOUTS
Paypal About to Breakout?
05/04/16 03:49:02 PMby Billy Williams
IPOs often fail but PYPL may be the outlier to rise from the ashes as it prepares to breakout.
Position: Buy
| Often, initial public offerings (IPOs) fail to live up to their initial hype. Most IPOs start off with a bang but then flounder, leaving traders holding stock that is worth less than half of what they paid. But one stock may be bucking the trend with the help of a little understood pattern that is unique to IPOs. This pattern separates the cream from the IPO crop allowing potential stock leaders to reveal themselves. In July of 2015, Paypal Holdings (PYPL) launched its IPO with a lot of hype from Wall Street. PYPL created a platform to allow buyers and sellers to conduct commerce on a global level. EBAY (EBAY) saw Paypal's potential. EBAY bought PYPL and later decided to spin the company off to increase its value to shareholders. |
| Those excited about the potential for PYPL's IPO were most likely disappointed on the day of the IPO. The company experienced the same "boom and bust" cycle of most IPOs. The stock traded down from its stock price of $42.35. PYPL later tried to rally but then the stock fell in price again. Things seemed bleak for the company but something good came out of something bad. Later on, a Double Bottom pattern formed on the stock's weekly chart indicating a likely reversal. |

|
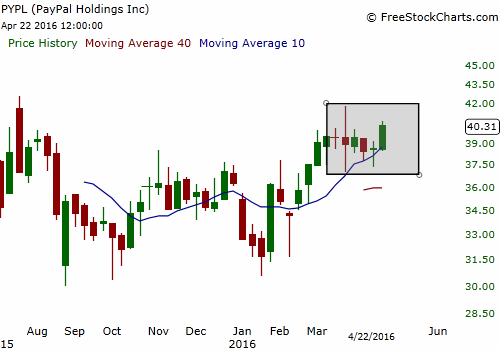
| Figure 1: PYPL Weekly. PYPL's rise and fall happened within months of its IPO. Over time, though, the stock formed a Double Bottom pattern which reversed its freefall and began climbing higher. |
| Graphic provided by: Freestockcharts.com. |
| |
| It's at this point where IPOs prove themselves, because rarely has a newly issued stock taken off and gone straight up. Often, an IPO will take off but then fall in value. By taking a "wait-and-see" approach you give it time prove itself a winner by digging itself out of its decline. From July 1, 2015, PYPL began the slow, sometimes painful, upwards march. The Double Bottom reconfirmed the stock's price reversal when it crossed its "neckline" on November 5, 2015. Afterwards, PYPL pulled back and visited the .50 Fib Retracement level. It's at this level where things begin to develop and get interesting. |

|
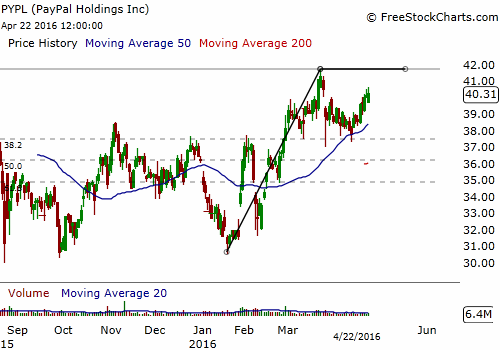
| Figure 2. PYPL Daily. PYPL found support at the $3o price level and went on to form a "handle" portion of a Cup & Handle pattern on the daily chart. The buy point is at $41.85 if the stock breaks out on higher volume. The higher volume will reveal that institutional traders are accumulating the stock. Their participation at this level will help price follow through after the breakout and lead to higher gains. |
| Graphic provided by: Freestockcharts.com. |
| |
| The stock found support at the 50-day SMA. Currently, the "handle" portion of a Cup & Handle price pattern is forming. If price manages to trade back up to $41.75, and on strong volume, then an entry would be triggered at $41.85. The key to PYPL's success at this point boils down to two factors: The overall market stays healthy and continues to rise and the stock breaks above its buy point on strong volume. |
| But, the general market's advance is under pressure, logging 5 distribution days already which is putting PYPL's advance into question. That said, take a partial position with controlled risk which will put you in the game if the breakout follows through. If so, then you can always add to your position as the trend develops. But, if it doesn't then you've already limited your initial risk. Go long at $41.85 with a 1% risk unless the market logs another distribution day between now and then. If it does, then abort the trade and wait for the market to reconfirm the uptrend. |
Billy Williams has been trading the markets for 27 years, specializing in momentum trading with stocks and options.
| Company: | StockOptionSystem.com |
| E-mail address: | stockoptionsystem.com@gmail.com |
Traders' Resource Links | |
| StockOptionSystem.com has not added any product or service information to TRADERS' RESOURCE. | |
Click here for more information about our publications!
PRINT THIS ARTICLE

|

Request Information From Our Sponsors
- StockCharts.com, Inc.
- Candle Patterns
- Candlestick Charting Explained
- Intermarket Technical Analysis
- John Murphy on Chart Analysis
- John Murphy's Chart Pattern Recognition
- John Murphy's Market Message
- MurphyExplainsMarketAnalysis-Intermarket Analysis
- MurphyExplainsMarketAnalysis-Visual Analysis
- StockCharts.com
- Technical Analysis of the Financial Markets
- The Visual Investor
- VectorVest, Inc.
- Executive Premier Workshop
- One-Day Options Course
- OptionsPro
- Retirement Income Workshop
- Sure-Fire Trading Systems (VectorVest, Inc.)
- Trading as a Business Workshop
- VectorVest 7 EOD
- VectorVest 7 RealTime/IntraDay
- VectorVest AutoTester
- VectorVest Educational Services
- VectorVest OnLine
- VectorVest Options Analyzer
- VectorVest ProGraphics v6.0
- VectorVest ProTrader 7
- VectorVest RealTime Derby Tool
- VectorVest Simulator
- VectorVest Variator
- VectorVest Watchdog
