HOT TOPICS LIST
- MACD
- Fibonacci
- RSI
- Gann
- ADXR
- Stochastics
- Volume
- Triangles
- Futures
- Cycles
- Volatility
- ZIGZAG
- MESA
- Retracement
- Aroon
INDICATORS LIST
LIST OF TOPICS
PRINT THIS ARTICLE
by Koos van der Merwe
The Apple watch has proved to be a no-no, so Apple has reduced its retail price and brought out a smaller iPhone. Is this the winner?
Position: Accumulate
Koos van der Merwe
Has been a technical analyst since 1969, and has worked as a futures and options trader with First Financial Futures in Johannesburg, South Africa.
PRINT THIS ARTICLE
TECHNICAL ANALYSIS
Another Bite Of The Apple
04/27/16 12:51:19 PMby Koos van der Merwe
The Apple watch has proved to be a no-no, so Apple has reduced its retail price and brought out a smaller iPhone. Is this the winner?
Position: Accumulate
| About a year ago, Apple brought out the Apple watch, a product that they believed would sell extremely well. However, the watch has not sold well. Tim Cook and his team appear to have forgotten that a fashion item, like a watch, is truly a piece of jewelery, which means that everyone would like to wear an item that is more beautiful and very different to what everyone else is wearing. A Rolex watch, for example, doesn't have to be more beautiful than an Omega watch, or a Seiko watch doesn't have to have more gadgets in it than a Rolex, it is simply the name, Rolex or Omega that sells the watch, nothing else. The fact that the Apple watch is a mini-computer linked to an iPhone is not enough to cause the world to buy it. So, what has happened to the share price over the past year, and what for the future? |

|
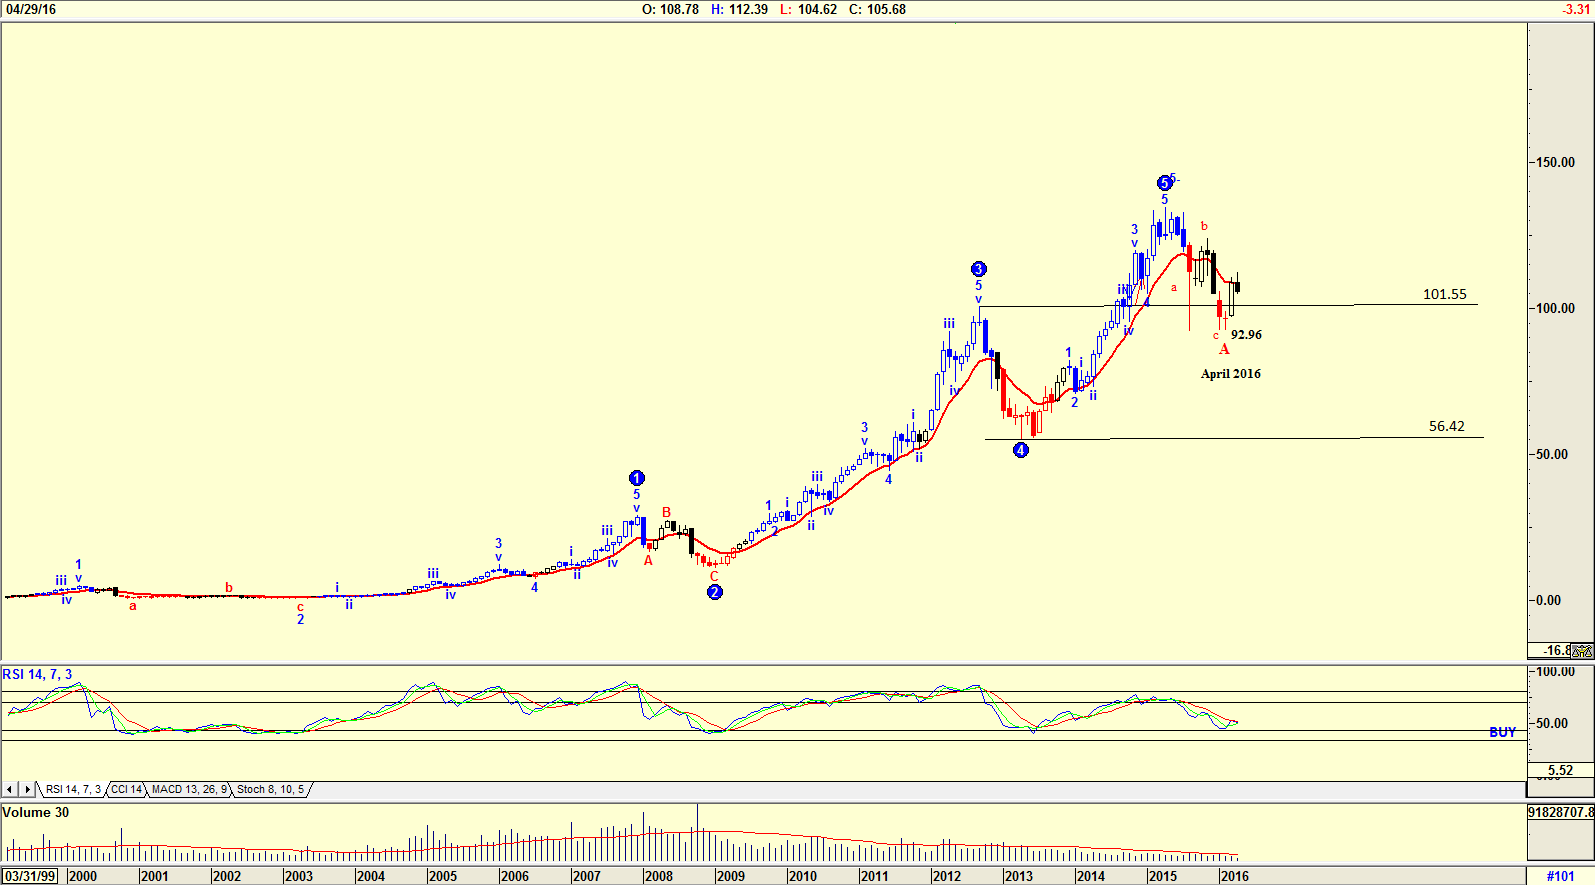
| Figure 1. AAPL monthly chart with Elliott wave count. |
| Graphic provided by: AdvancedGET. |
| |
| The chart in Figure 1 is a monthly chart with an Elliott wave count suggesting that the share price of Apple has completed a major WAVE 5 and is now in the process of doing an ABC correction. The chart shows that the price is within the 4th wave of lesser degree falling to $92.96 in April 2016. This means that it should start rising either in a B-WAVE before falling further in a C-WAVE not lower than $56.42, the low end of WAVE 4, or the WAVE A shown on the chart could be a WAVE C, and the share price will start rising in a Wave 1 of a new uptrend. The RSI indicator has fallen and is testing the buy level, suggesting that a buy has possibly been given. Volume, however, is below average, suggesting that many investors are staying away from the shares. |

|
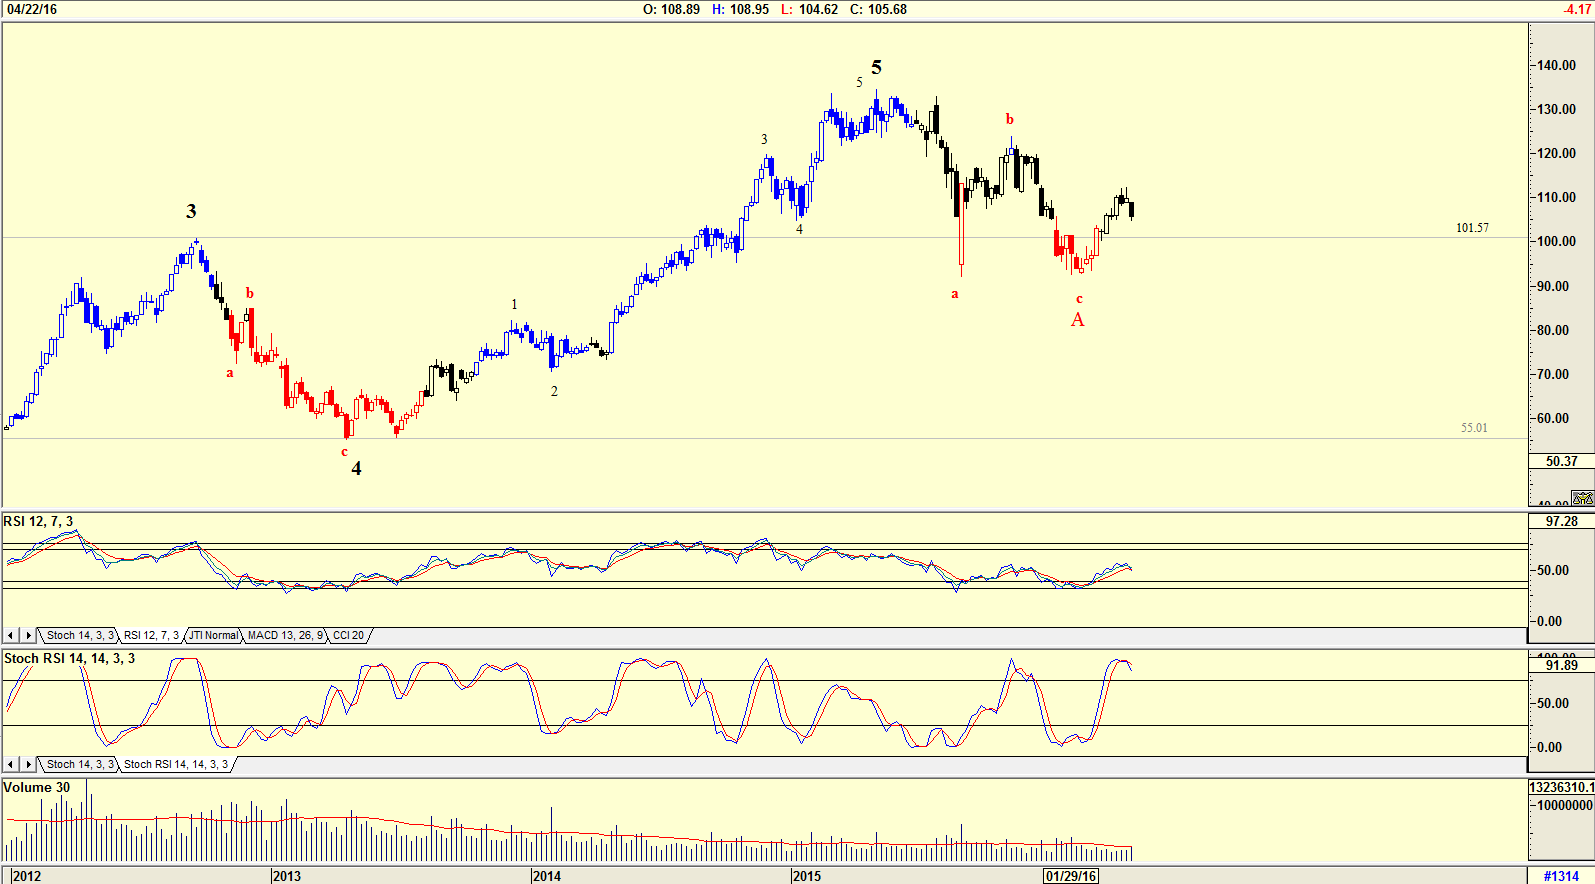
| Figure 2. AAPL weekly chart with Elliott wave count. |
| Graphic provided by: AdvancedGET. |
| |
| Looking at the weekly chart in Figure 2 the Elliott wave pattern is confirming the completion of a WAVE A down. The RSI indicator is suggesting strength, but the Stochastic RSI indicator is suggesting weakness. The share price could then start rising in a WAVE B before falling in a WAVE C. Volume is below average. |

|
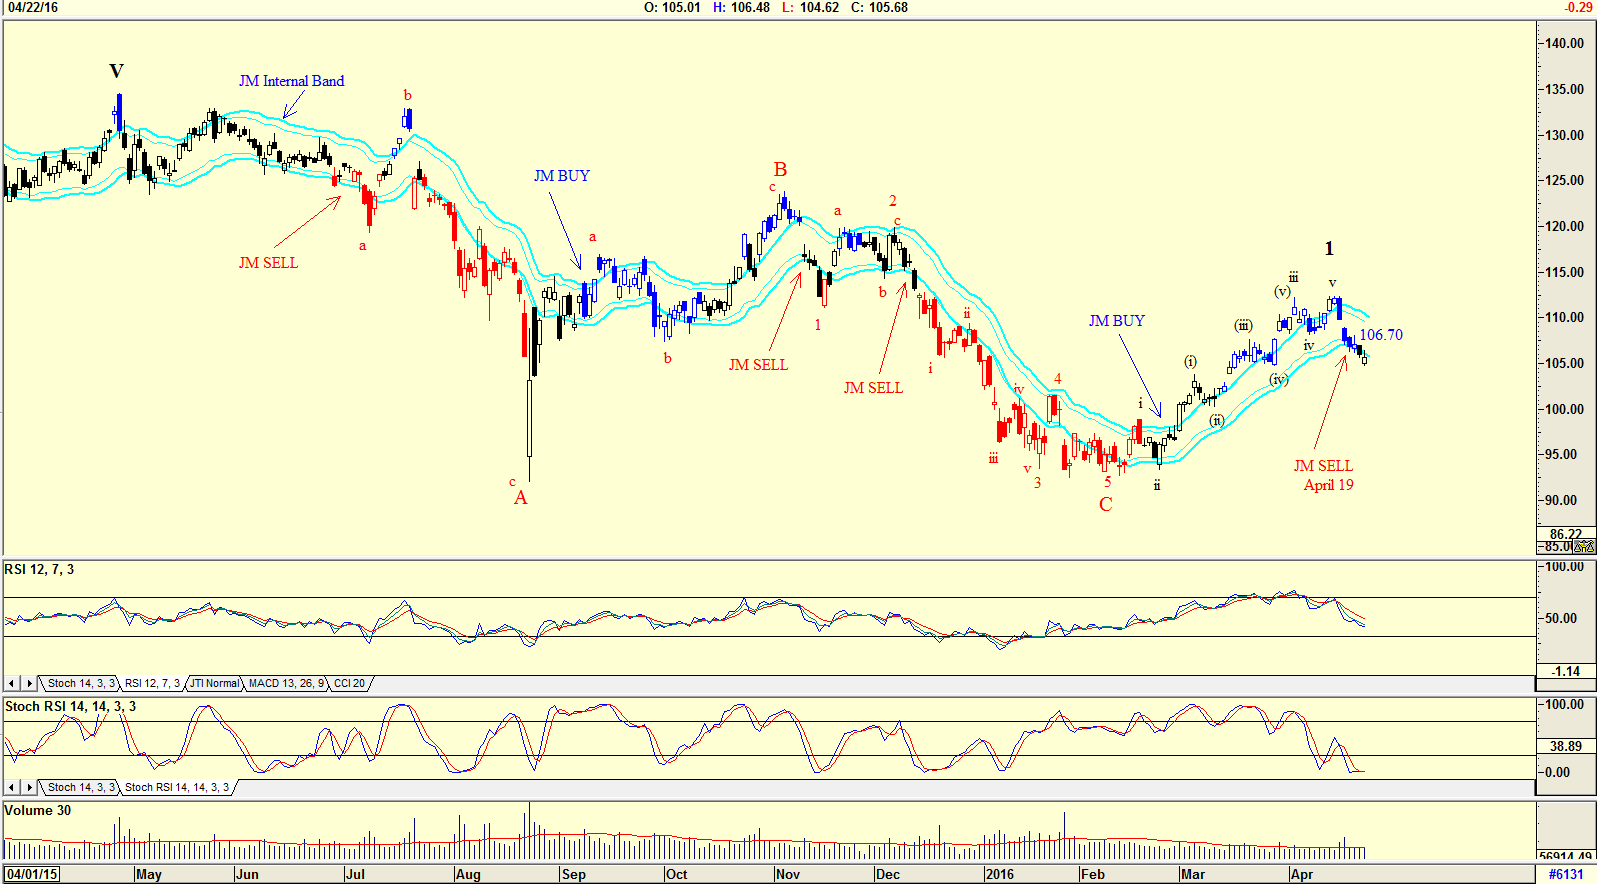
| Figure 3. AAPL daily chart with JM Internal Band and Elliott wave count. |
| Graphic provided by: AdvancedGET. |
| |
| The chart in Figure 3 is a daily chart with a JM Internal Band. The chart is showing that a JM sell signal was given on April 19 when the share price was $106.70. The JM Internal Band is a 15 period simple moving average offset by 2% plus and 2% negative. A buy signal is given when the share price moves above the upper band, and a sell signal is given when the share price moves below the lower band. The RSI indicator is trending down and has not reached the buy zone. The Stochastic RSI indicator is at the oversold level, but has not yet given a buy signal. Volume is still below average. The share of Apple is a share that one should watch and buy when the indicators suggest a buy. With its continual attempt to reinvent the ingenuity of Steve Jobs, they will eventually succeed, either by trial and error, or simply by good luck. This is a share definitely on my watch list. |
Has been a technical analyst since 1969, and has worked as a futures and options trader with First Financial Futures in Johannesburg, South Africa.
| Address: | 3256 West 24th Ave |
| Vancouver, BC | |
| Phone # for sales: | 6042634214 |
| E-mail address: | petroosp@gmail.com |
Click here for more information about our publications!
PRINT THIS ARTICLE

Request Information From Our Sponsors
- StockCharts.com, Inc.
- Candle Patterns
- Candlestick Charting Explained
- Intermarket Technical Analysis
- John Murphy on Chart Analysis
- John Murphy's Chart Pattern Recognition
- John Murphy's Market Message
- MurphyExplainsMarketAnalysis-Intermarket Analysis
- MurphyExplainsMarketAnalysis-Visual Analysis
- StockCharts.com
- Technical Analysis of the Financial Markets
- The Visual Investor
- VectorVest, Inc.
- Executive Premier Workshop
- One-Day Options Course
- OptionsPro
- Retirement Income Workshop
- Sure-Fire Trading Systems (VectorVest, Inc.)
- Trading as a Business Workshop
- VectorVest 7 EOD
- VectorVest 7 RealTime/IntraDay
- VectorVest AutoTester
- VectorVest Educational Services
- VectorVest OnLine
- VectorVest Options Analyzer
- VectorVest ProGraphics v6.0
- VectorVest ProTrader 7
- VectorVest RealTime Derby Tool
- VectorVest Simulator
- VectorVest Variator
- VectorVest Watchdog
