HOT TOPICS LIST
- MACD
- Fibonacci
- RSI
- Gann
- ADXR
- Stochastics
- Volume
- Triangles
- Futures
- Cycles
- Volatility
- ZIGZAG
- MESA
- Retracement
- Aroon
INDICATORS LIST
LIST OF TOPICS
PRINT THIS ARTICLE
by Koos van der Merwe
On Friday, April 15th, Ted Cruz stated why he believed a stock crash will be coming.
Position: Sell
Koos van der Merwe
Has been a technical analyst since 1969, and has worked as a futures and options trader with First Financial Futures in Johannesburg, South Africa.
PRINT THIS ARTICLE
TECHNICAL ANALYSIS
The Coming Stock Crash
04/20/16 02:41:16 PMby Koos van der Merwe
On Friday, April 15th, Ted Cruz stated why he believed a stock crash will be coming.
Position: Sell
| The Federal Reserve's excessively easy monetary policies are "playing games with money" and are an ineffective way to "juice the system," GOP Presidential candidate Ted Cruz told CNBC. Such actions "create bubbles," he said. "The Fed has, for those with assets, driven up stock prices," he said in a wide-ranging "Squawk Box" interview four days before the New York primary. The question on everyone's mind is, is he challenging Donald Trump ahead of the New York elections? Donald Trump announced a few weeks ago that the economy was headed for a major recession, but if elected President, he would see that the recession would not occur. So, the question now on everyone's mind is, "Is this politics? Or is the recession a very real possibility." As you all know, I have been writing for many years now, that a recession would start sometime in the year 2016. Highlighting the exact date is not easy, but one should keep in mind the maxim "Sell in May and go away." What do the charts say now? |

|
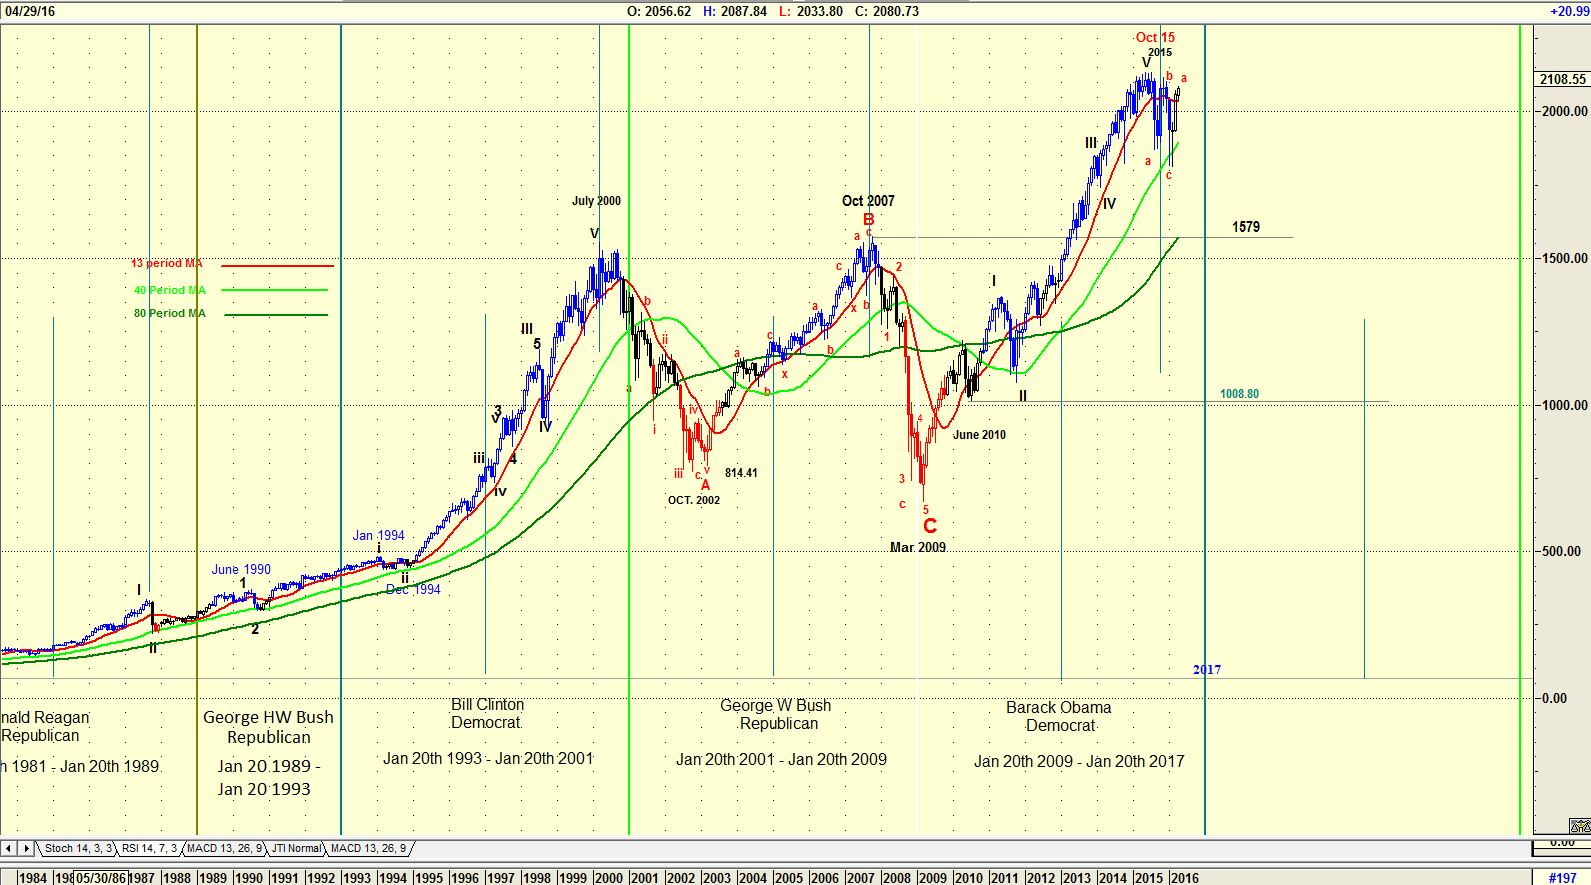
| Figure 1. Monthly chart of the S&P500 Index and the Presidential cycle. |
| Graphic provided by: AdvancedGET. |
| |
| The chart in Figure 1 is a monthly chart of the S&P500 Index over laid on the Presidential cycle. Note how in October of the year before the newly elected President takes office the S&P 500 index reaches a high and then starts to fall. This occurred during President Bill Clinton's term of office, Pres. George W Bush's term of office and now Pres. Barak Obama's term of office. Does this mean that the correction will continue into the next President's term of office as shown on the charts? Then of course comes the question, is the Elliott wave count correct? |

|
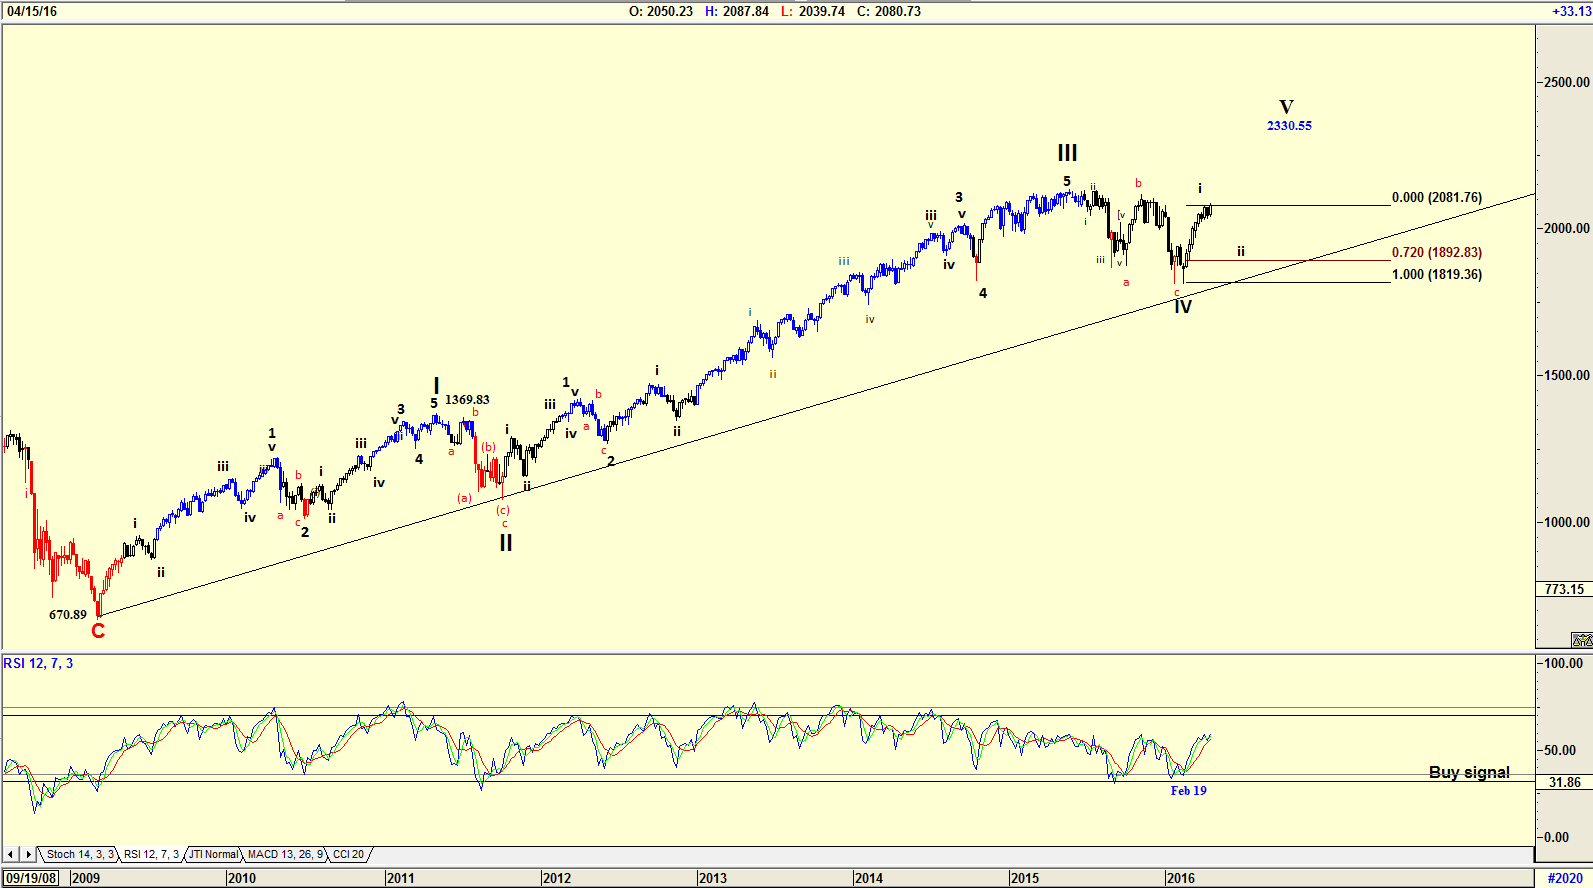
| Figure 2. Weekly chart of the S&P 500 index with an Elliott wave count. |
| Graphic provided by: AdvancedGET. |
| |
| The weekly chart in Figure 2 shows the index possibly preparing to fall in a wave ii of a Major WAVE V. This is confirmed by the RSI index which is suggesting an uptrend after giving a buy signal on February 19th, 2016. Will the index reach the suggested target of 2330.55 as shown on the chart? This could indeed occur, but a wave ii down has to occur first and this could be a 72% retracement of Wave I of WAVE V, which means that the index could drop to 1892.83, which is a correction of approximately 9%. Of course, there is always the possibility that the RSI indicator and wave count could be incorrect. Negative statements by politicians could, however, be scaring investors out of the market. |

|
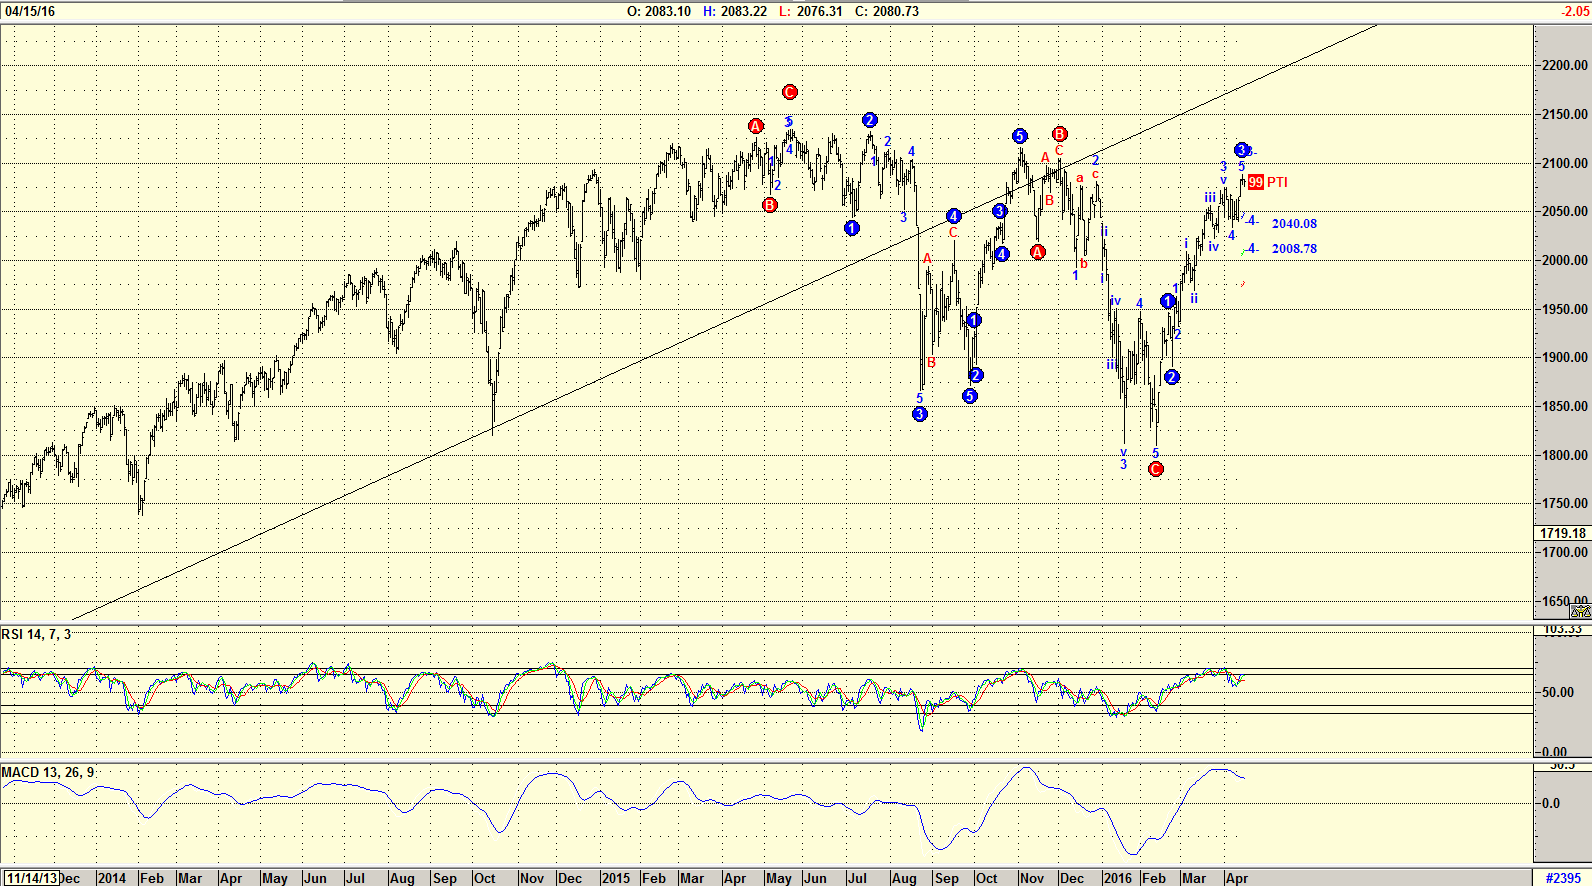
| Figure 3. Daily chart of the S&P 500 index. |
| Graphic provided by: AdvancedGET. |
| |
| The daily chart in Figure 3 shows an Elliott wave count suggested by the Advanced GET program. The count is suggesting a Wave 4 correction to either the 2040.08 level or the 2008.78 level. The PTI of 99 (probability Index) suggests a 99% probability that this will indeed occur. With the RSI Index at overbought levels and trending down, and with the MACD indicator trending down, the "SELL IN MAY and GO AWAY" maxim could occur in April and not May. Both Republican candidates are suggesting that the US economy — perhaps even the World economy — is headed into recession. We have yet to hear the Democratic candidates suggesting that a recession is due. Will one occur? My charts are suggesting yes, there will be a recession, and a nasty one at that. Many analysts are suggesting otherwise, believing steadfastly in the ability of the current chair of the US Federal Reserve, Janet Yellen, to keep the US economy on a sound footing. Will she be successful in her endeavor? Only time will tell. In the meantime, investors, because of market uncertainty ahead of the political campaign and the "SELL in MAY" maxim, are exiting the market, and being cautious. |
Has been a technical analyst since 1969, and has worked as a futures and options trader with First Financial Futures in Johannesburg, South Africa.
| Address: | 3256 West 24th Ave |
| Vancouver, BC | |
| Phone # for sales: | 6042634214 |
| E-mail address: | petroosp@gmail.com |
Click here for more information about our publications!
Comments

Request Information From Our Sponsors
- StockCharts.com, Inc.
- Candle Patterns
- Candlestick Charting Explained
- Intermarket Technical Analysis
- John Murphy on Chart Analysis
- John Murphy's Chart Pattern Recognition
- John Murphy's Market Message
- MurphyExplainsMarketAnalysis-Intermarket Analysis
- MurphyExplainsMarketAnalysis-Visual Analysis
- StockCharts.com
- Technical Analysis of the Financial Markets
- The Visual Investor
- VectorVest, Inc.
- Executive Premier Workshop
- One-Day Options Course
- OptionsPro
- Retirement Income Workshop
- Sure-Fire Trading Systems (VectorVest, Inc.)
- Trading as a Business Workshop
- VectorVest 7 EOD
- VectorVest 7 RealTime/IntraDay
- VectorVest AutoTester
- VectorVest Educational Services
- VectorVest OnLine
- VectorVest Options Analyzer
- VectorVest ProGraphics v6.0
- VectorVest ProTrader 7
- VectorVest RealTime Derby Tool
- VectorVest Simulator
- VectorVest Variator
- VectorVest Watchdog
