HOT TOPICS LIST
- MACD
- Fibonacci
- RSI
- Gann
- ADXR
- Stochastics
- Volume
- Triangles
- Futures
- Cycles
- Volatility
- ZIGZAG
- MESA
- Retracement
- Aroon
INDICATORS LIST
LIST OF TOPICS
PRINT THIS ARTICLE
by Billy Williams
Dave & Buster's Entertainment, Inc. (PLAY) has fired off a long signal and has momentum to go higher.
Position: Buy
Billy Williams
Billy Williams has been trading the markets for 27 years, specializing in momentum trading with stocks and options.
PRINT THIS ARTICLE
PLAY is Eating Up The Competition
04/19/16 04:05:59 PMby Billy Williams
Dave & Buster's Entertainment, Inc. (PLAY) has fired off a long signal and has momentum to go higher.
Position: Buy
| The U.S. is a foodie's paradise, with restaurants and leisurely eating spots on virtually every corner of every neighborhood — and for Wall Street it's big business. Specialty restaurants devoted to lunch, breakfast, steak, seafood, ethnic menus, and more are growing in popularity. Having a wide variety of places to eat offer consumers a variety of places to meet for lunch and dinner, as well as coffee and dessert. That said, there is a gap in the industry for families with small children, where parents look to go out and eat together but also have small children to entertain. Parents can order their meals and have a conversation until the order arrives, but not when there is a 4-year old child getting restless and more bored by the minute. |

|
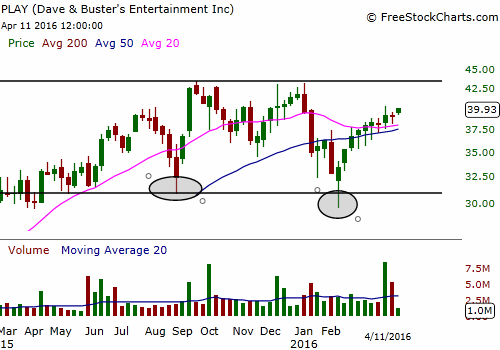
| Figure 1. PLAY Weekly. The weekly price chart on PLAY reveals a Double-Bottom pattern that has formed support and reversed the stock's decline. The stock has resumed its upward trend and recovered over 80% of the lost ground from the decline almost guaranteeing that the all-time price of $43.55 will be tested. |
| Graphic provided by: FreeStockCharts.com. |
| |
| This can be tough on working families who want to go out together but have to balance their decisions on eating out with taking care of small children. And, it's a lucrative market where there isn't much competition for a company who wants to stake its claim with family friendly activities coupled with a good menu that includes something for everyone, adults and kids alike. Companies like Dave & Busters(PLAY)are in a hard-fought battle to cater to this market and things are getting heated. But, PLAY is gaining ground and setting up to be a good opportunity for the trader who is prepared. The big bright spot in this sector for a trader is the fact that PLAY is trading within 10% of its all-time high plus displaying compelling technical strength. |
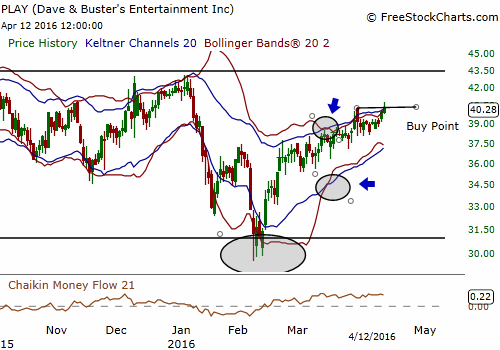
| Looking under the hood, PLAY has been a strong fundamental performer which has added the necessary fuel to the stock's upward trajectory. Facing the same challenges in mid-September of 2015, the stock held up and has been repairing the technical damage from that decline. In addition, it formed a weekly double bottom pattern which reversed its downward slide to help the stock trade back up back above the 40 SMA. In mid-March of this year, the stock formed a "squeeze" on the daily chart where the Bollinger Bands traded within the Keltner Channels and a long setup was established. A buy signal was recently triggered at the $40 price level but the Bollinger Bands haven't traded outside the Keltner Channels yet to confirm the entry, but that could come in the next few days. |

|
| Figure 2. PLAY Daily. Chunking down to a smaller time frame, PLAY has formed a Squeeze setup and a buy point at the $40 price level. An entry was confirmed as it traded through this price point on higher volume and is headed north again. Overhead resistance lies just above PLAY's price action with a second opportunity to go long at the $43.55 level if volume confirms it. |
| Graphic provided by: FreeStockCharts.com. |
| |
| That said, PLAY has several overhead resistance levels to overcome before it resumes its upward trend past its all-time price high of $43.35. But, the fact that PLAY has traded back more than 80% of its previous range — from the high of $43.35 to the low of the decline from that point to $29.54 — weighs the odds heavily that $43.35 will assuredly be tested again. If you missed this recent entry then wait for the stock to pullback slightly on low volume and buy into it. Or, if you're more conservative then wait for price to retest the $43.55 price level and buy into the move if it breaks out on volume of 150% or greater than it's 20-average volume level. |
Billy Williams has been trading the markets for 27 years, specializing in momentum trading with stocks and options.
| Company: | StockOptionSystem.com |
| E-mail address: | stockoptionsystem.com@gmail.com |
Traders' Resource Links | |
| StockOptionSystem.com has not added any product or service information to TRADERS' RESOURCE. | |
Click here for more information about our publications!
PRINT THIS ARTICLE

Request Information From Our Sponsors
- StockCharts.com, Inc.
- Candle Patterns
- Candlestick Charting Explained
- Intermarket Technical Analysis
- John Murphy on Chart Analysis
- John Murphy's Chart Pattern Recognition
- John Murphy's Market Message
- MurphyExplainsMarketAnalysis-Intermarket Analysis
- MurphyExplainsMarketAnalysis-Visual Analysis
- StockCharts.com
- Technical Analysis of the Financial Markets
- The Visual Investor
- VectorVest, Inc.
- Executive Premier Workshop
- One-Day Options Course
- OptionsPro
- Retirement Income Workshop
- Sure-Fire Trading Systems (VectorVest, Inc.)
- Trading as a Business Workshop
- VectorVest 7 EOD
- VectorVest 7 RealTime/IntraDay
- VectorVest AutoTester
- VectorVest Educational Services
- VectorVest OnLine
- VectorVest Options Analyzer
- VectorVest ProGraphics v6.0
- VectorVest ProTrader 7
- VectorVest RealTime Derby Tool
- VectorVest Simulator
- VectorVest Variator
- VectorVest Watchdog
