HOT TOPICS LIST
- MACD
- Fibonacci
- RSI
- Gann
- ADXR
- Stochastics
- Volume
- Triangles
- Futures
- Cycles
- Volatility
- ZIGZAG
- MESA
- Retracement
- Aroon
INDICATORS LIST
LIST OF TOPICS
PRINT THIS ARTICLE
by Koos van der Merwe
Despite a rough recent history in China, McDonald's Corp. is joining a number of companies that have made bullish bets on Chinese consumers. Over the next five years the Oak Brook, IL, company is hunting for an investment partner to help build out its franchise business in China, and plans to add 1,300 restaurants to its current 2,200. The fast-food company is betting that population growth and urbanization rates will continue to propel sales even as the world economy slows. While larger discretionary items will take a hit amid an economic slowdown, smaller splurges like fast-food meals should, by all accounts, stay strong.
Position: Hold
Koos van der Merwe
Has been a technical analyst since 1969, and has worked as a futures and options trader with First Financial Futures in Johannesburg, South Africa.
PRINT THIS ARTICLE
McDonald's Corp.
04/19/16 02:44:57 PMby Koos van der Merwe
Despite a rough recent history in China, McDonald's Corp. is joining a number of companies that have made bullish bets on Chinese consumers. Over the next five years the Oak Brook, IL, company is hunting for an investment partner to help build out its franchise business in China, and plans to add 1,300 restaurants to its current 2,200. The fast-food company is betting that population growth and urbanization rates will continue to propel sales even as the world economy slows. While larger discretionary items will take a hit amid an economic slowdown, smaller splurges like fast-food meals should, by all accounts, stay strong.
Position: Hold
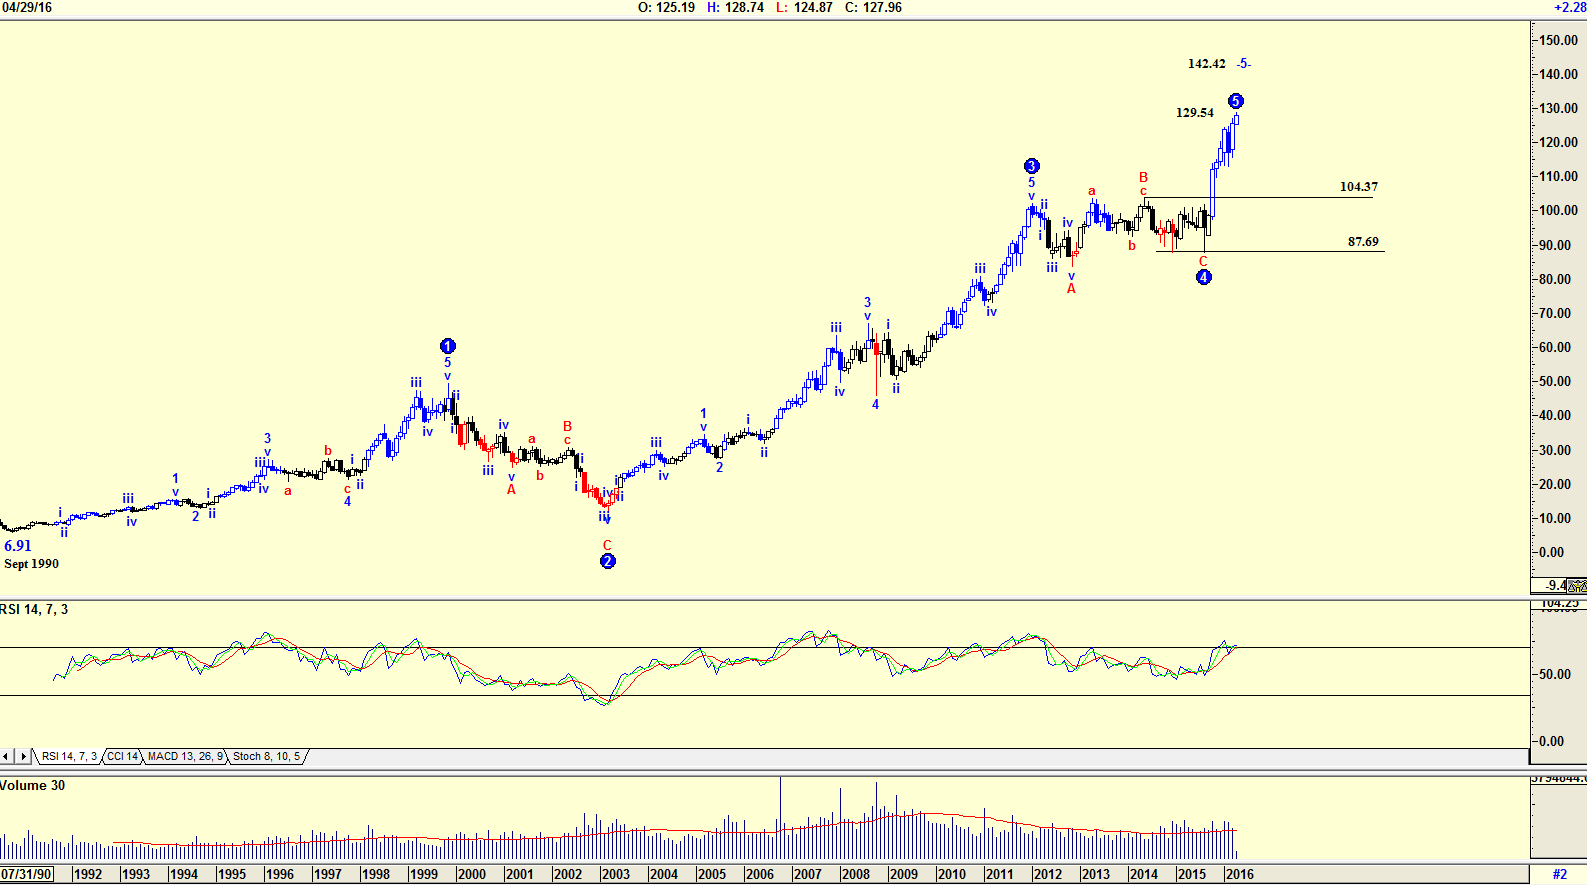
| The chart in Figure 1 is a monthly chart of McDonald's showing how the price of the share rose from a low of $6.91 in September 1990 to its present high of $129.54. The Elliott wave count suggests that the share price is in a WAVE 5 and could rise to $142.42 before correcting in an ABC wave. This is confirmed by the RSI indicator which is at overbought levels. However, should the share price correct, it will fall to the 4t wave of lesser degree, somewhere between $87.69 and $104.37. |

|
| Figure 1. Monthly chart suggesting a possible correction is due. |
| Graphic provided by: AdvancedGET. |
| |
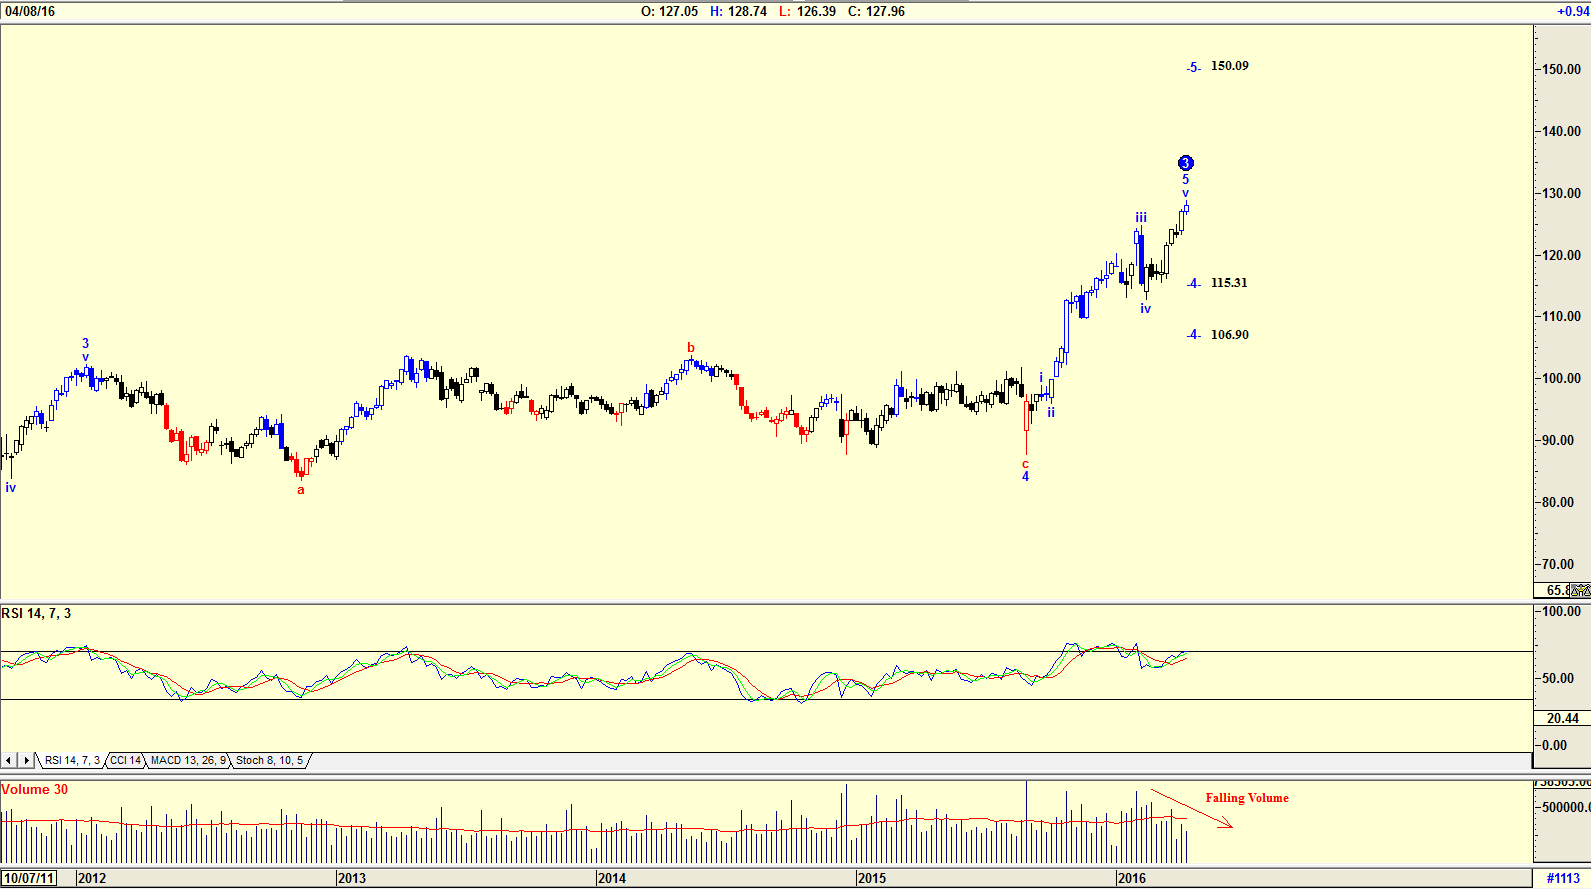
| The chart in Figure 2 is a weekly chart with an Elliott wave count suggesting that a WAVE 3 is complete and that the share price should fall in a WAVE 4 to somewhere between $106.90 and $115.31 before rising in a WAVE 5 to $150.09. The RSI indicator is overbought suggesting that the correction could occur in the near future. Also note the volume, which has been falling as the share price rose. Falling volume as the share price rises is a sign of weakness. |

|
| Figure 2. Weekly chart suggesting weakness as the share price rose. |
| Graphic provided by: AdvancedGET. |
| |
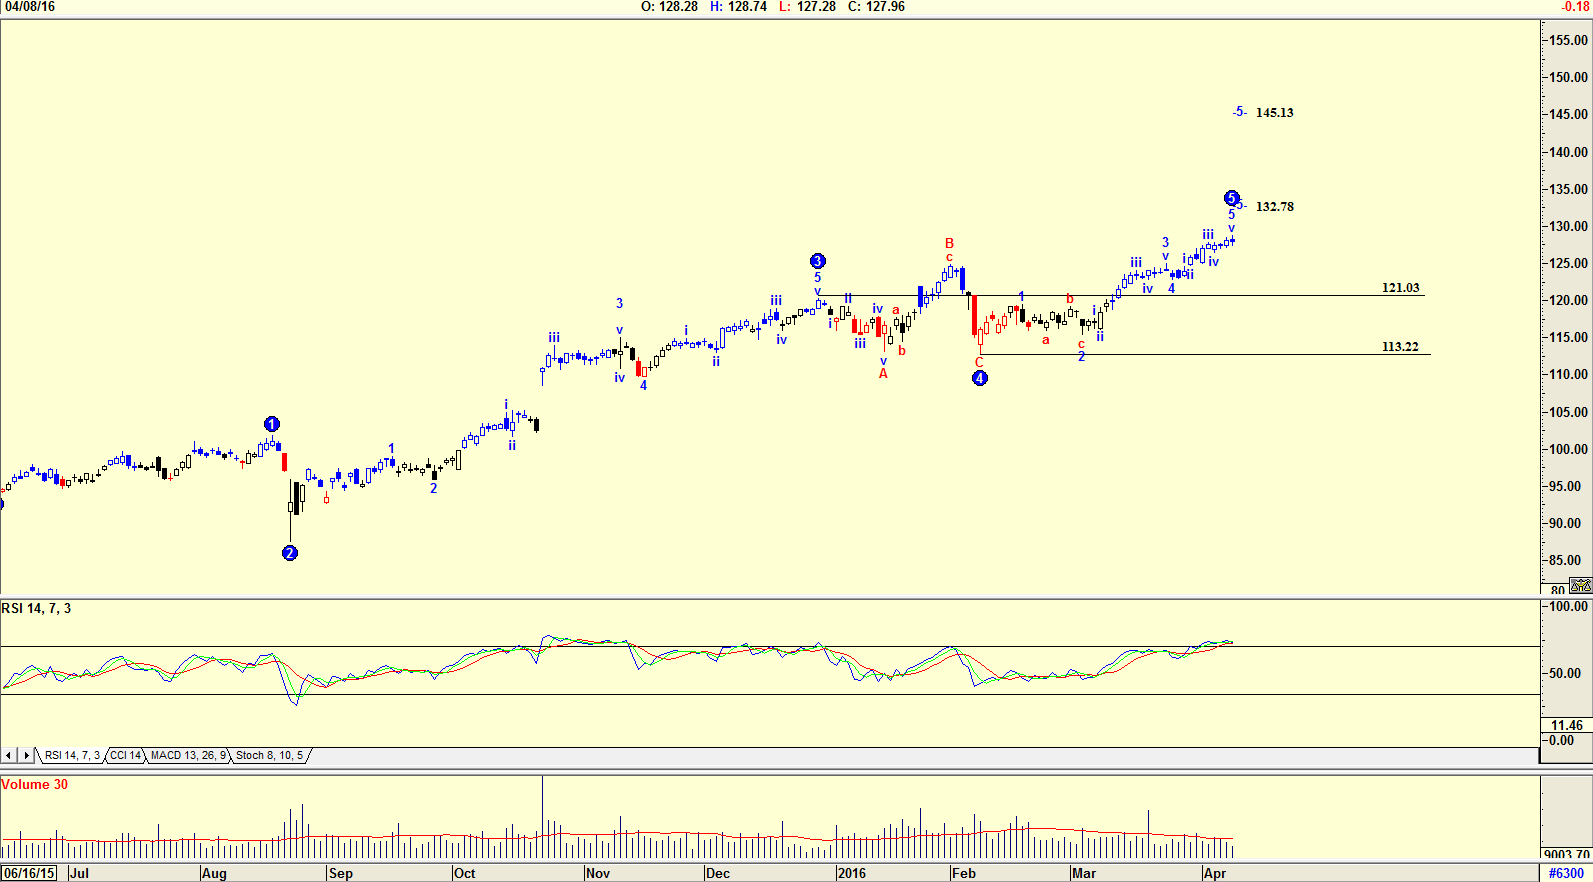
| The chart in Figure 3 is a daily chart with an Elliott wave count suggesting that the share price could rise to $132.78 or $145.13 before correcting in an ABC wave to the 4th wave of lesser degree. Of course, as we know, an Elliott wave is a signpost in the wilderness, so as the share price moves, the target price for WAVE 5 will change, but the 4th wave of lesser degree will remain the same. The JM Internal Band is still in buy mode. The JM Internal Band is a 15 period simple moving average offset by 2% positive and 2% negative. A move upper the upper band suggests a buy, and below the lower band a sell. With McDonald's Corp. starting to open branches in China, the share price should rise. The charts are however suggestion a correction is on the cards, with the monthly chart suggesting that the share price should fall to somewhere between $87.69 and $104.37 while the daily chart is suggesting that the share price should only fall to somewhere between $113.22 and $121.03 should the correction occur. Will the reason for the correction be caused by the expenses involved in opening the restaurants in China, or will they be the result of a future recession? Time will tell, but it is a share one should watch and be ready to purchase once the ABC correction is complete. |

|
| Figure 3. Daily chart with JM Internal Band indicator. |
| Graphic provided by: AdvancedGET. |
| |
Has been a technical analyst since 1969, and has worked as a futures and options trader with First Financial Futures in Johannesburg, South Africa.
| Address: | 3256 West 24th Ave |
| Vancouver, BC | |
| Phone # for sales: | 6042634214 |
| E-mail address: | petroosp@gmail.com |
Click here for more information about our publications!
PRINT THIS ARTICLE

Request Information From Our Sponsors
- VectorVest, Inc.
- Executive Premier Workshop
- One-Day Options Course
- OptionsPro
- Retirement Income Workshop
- Sure-Fire Trading Systems (VectorVest, Inc.)
- Trading as a Business Workshop
- VectorVest 7 EOD
- VectorVest 7 RealTime/IntraDay
- VectorVest AutoTester
- VectorVest Educational Services
- VectorVest OnLine
- VectorVest Options Analyzer
- VectorVest ProGraphics v6.0
- VectorVest ProTrader 7
- VectorVest RealTime Derby Tool
- VectorVest Simulator
- VectorVest Variator
- VectorVest Watchdog
- StockCharts.com, Inc.
- Candle Patterns
- Candlestick Charting Explained
- Intermarket Technical Analysis
- John Murphy on Chart Analysis
- John Murphy's Chart Pattern Recognition
- John Murphy's Market Message
- MurphyExplainsMarketAnalysis-Intermarket Analysis
- MurphyExplainsMarketAnalysis-Visual Analysis
- StockCharts.com
- Technical Analysis of the Financial Markets
- The Visual Investor
