HOT TOPICS LIST
- MACD
- Fibonacci
- RSI
- Gann
- ADXR
- Stochastics
- Volume
- Triangles
- Futures
- Cycles
- Volatility
- ZIGZAG
- MESA
- Retracement
- Aroon
INDICATORS LIST
LIST OF TOPICS
PRINT THIS ARTICLE
by Koos van der Merwe
Tesla's Model 3 has already racked up 232,000 pre-orders.
Position: Sell
Koos van der Merwe
Has been a technical analyst since 1969, and has worked as a futures and options trader with First Financial Futures in Johannesburg, South Africa.
PRINT THIS ARTICLE
ELLIOTT WAVE
A Look At Tesla
04/13/16 03:46:49 PMby Koos van der Merwe
Tesla's Model 3 has already racked up 232,000 pre-orders.
Position: Sell
| Elon Musk, in a show reminiscent of the shows Steve Jobs of Apple gave when introducing a new product, announced that his company, Tesla, was introducing the Tesla Model 3 car with a starting price of $35,000 before incentives. His announcement immediately attracted 180,000 pre-orders in just 24 hours. Morgan Stanley called Tesla's shares undervalued and announced that they expected the Model 3 to be the start of a cataclysmic change in the motorcar industry. |

|
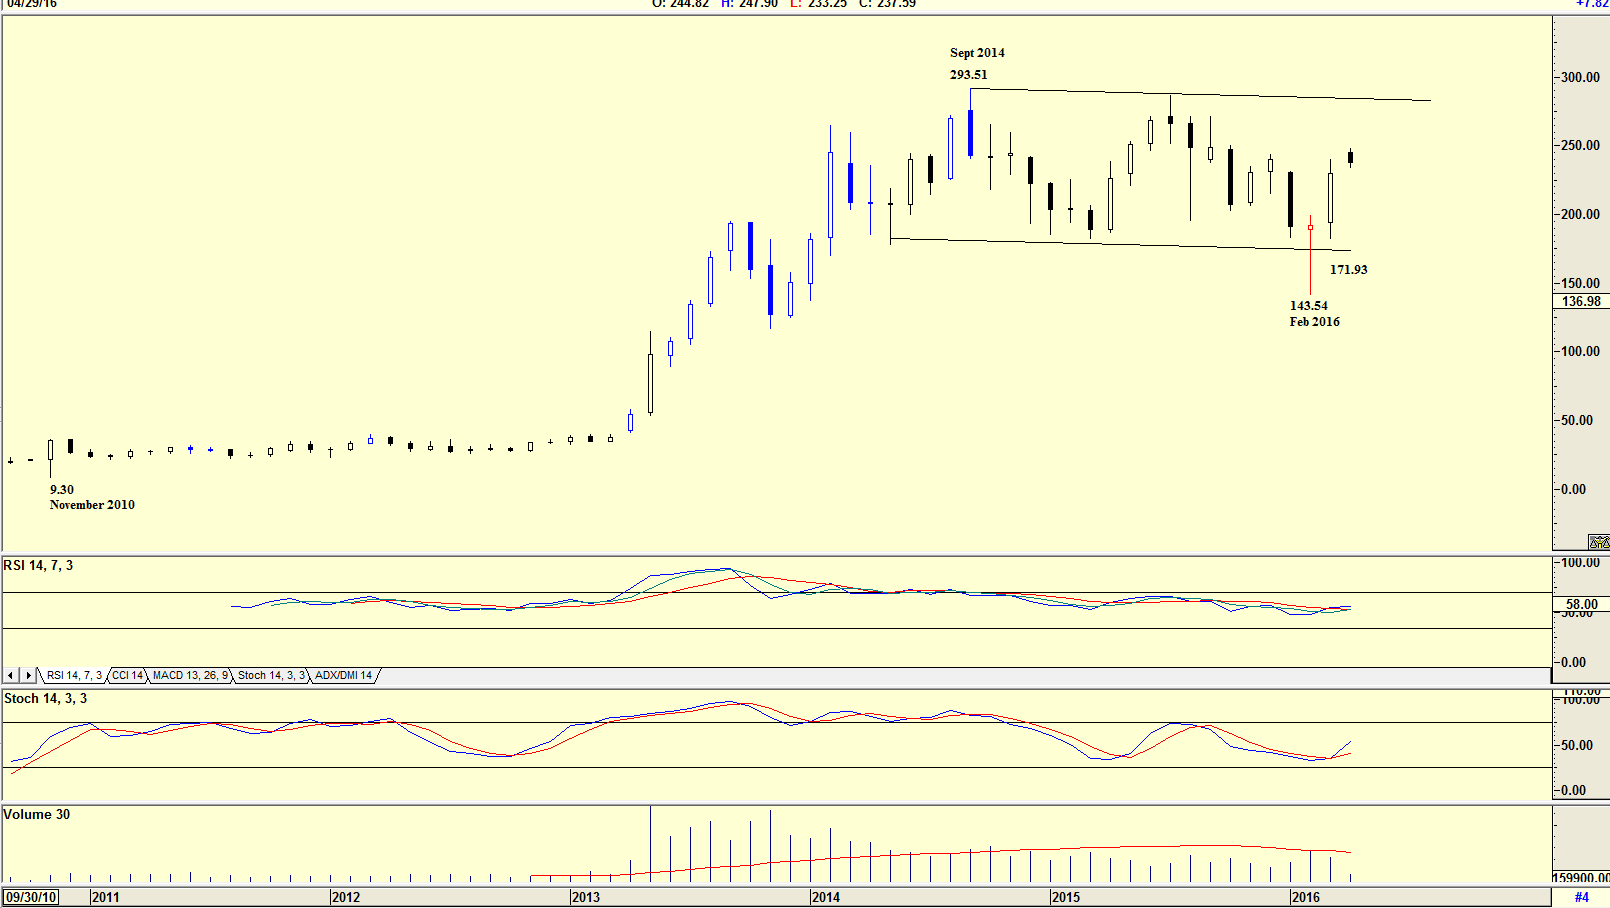
| Figure 1. Monthly chart for Tesla. |
| Graphic provided by: AdvancedGET. |
| |
| The chart in Figure 1 is a monthly chart showing how the share price moved from a low of $9.10 on November 2010 to a high of $293.51 by September 2014. Since then the share has been moving in a sideways trend falling to a low of $143.54 by February 2016 as shown on the chart. The two indicators, the RSI 14 period and the Stochastic are both trending down. Volume, as shown on the chart has been falling suggesting weakness. Over the long term then, investors would have been careful of putting their money in shares of Tesla. |

|
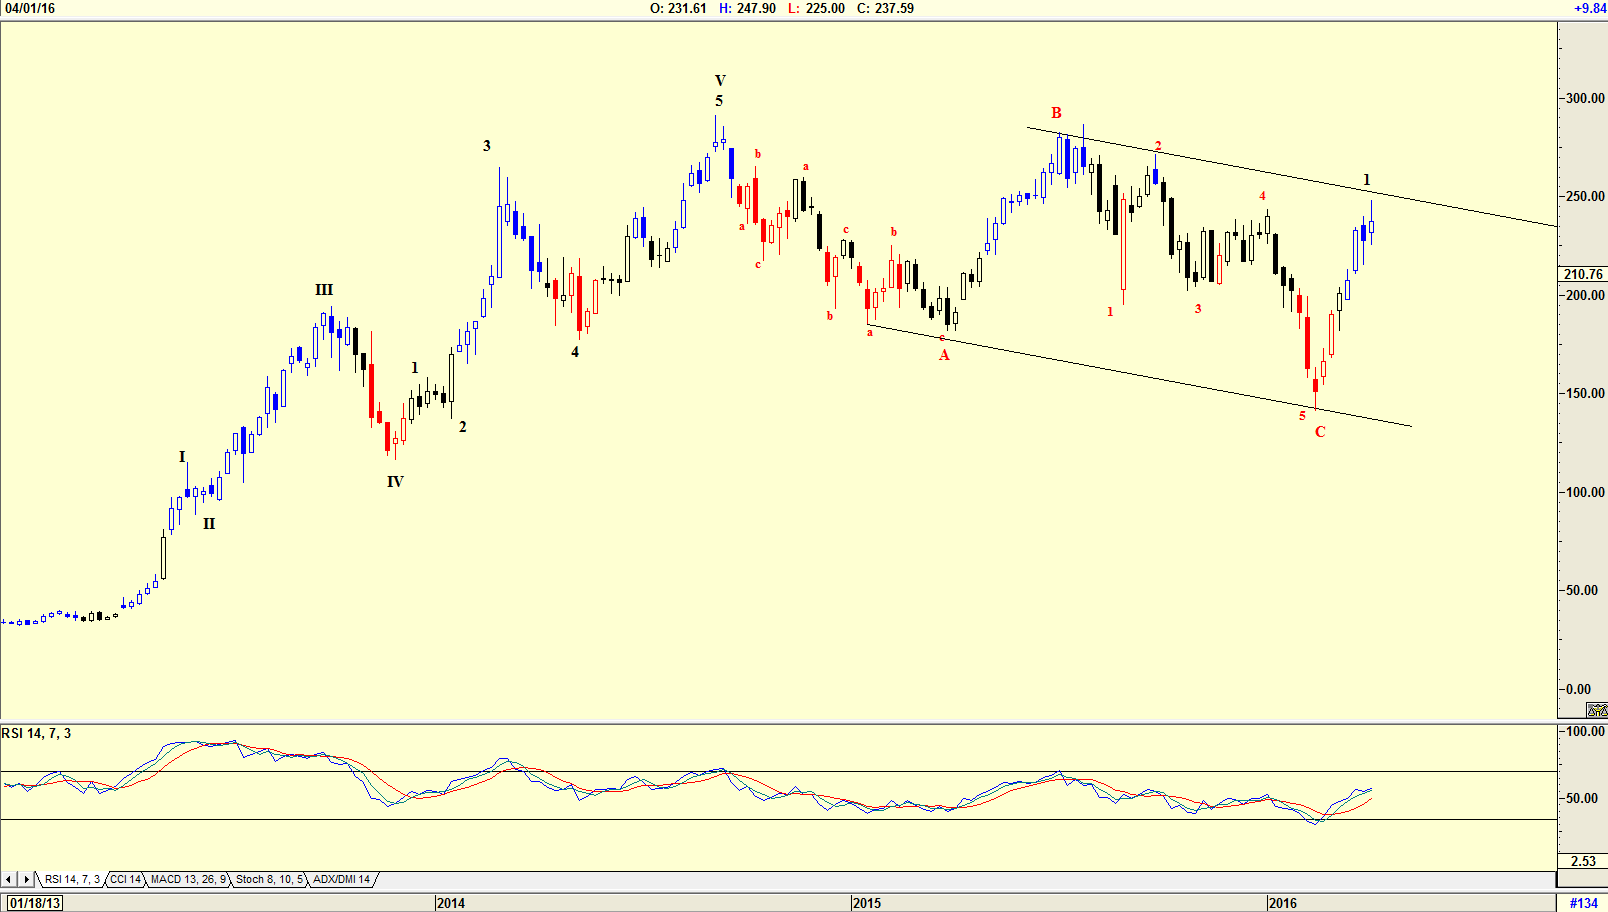
| Figure 2. Weekly chart of Tesla suggesting weakness. |
| Graphic provided by: AdvancedGET. |
| |
| The weekly chart on the other hand, suggests that an ABC correction has been completed and that the share price is now trending upwards in a WAVE 1. This is confirmed by the RSI 14 indicator which is trending upwards. The WAVE 1 should be followed by a WAVE 2 correction which could fall as much as 72% of the rise of WAVE 1. The chart is therefore suggesting that one should wait before investing in the share. |

|
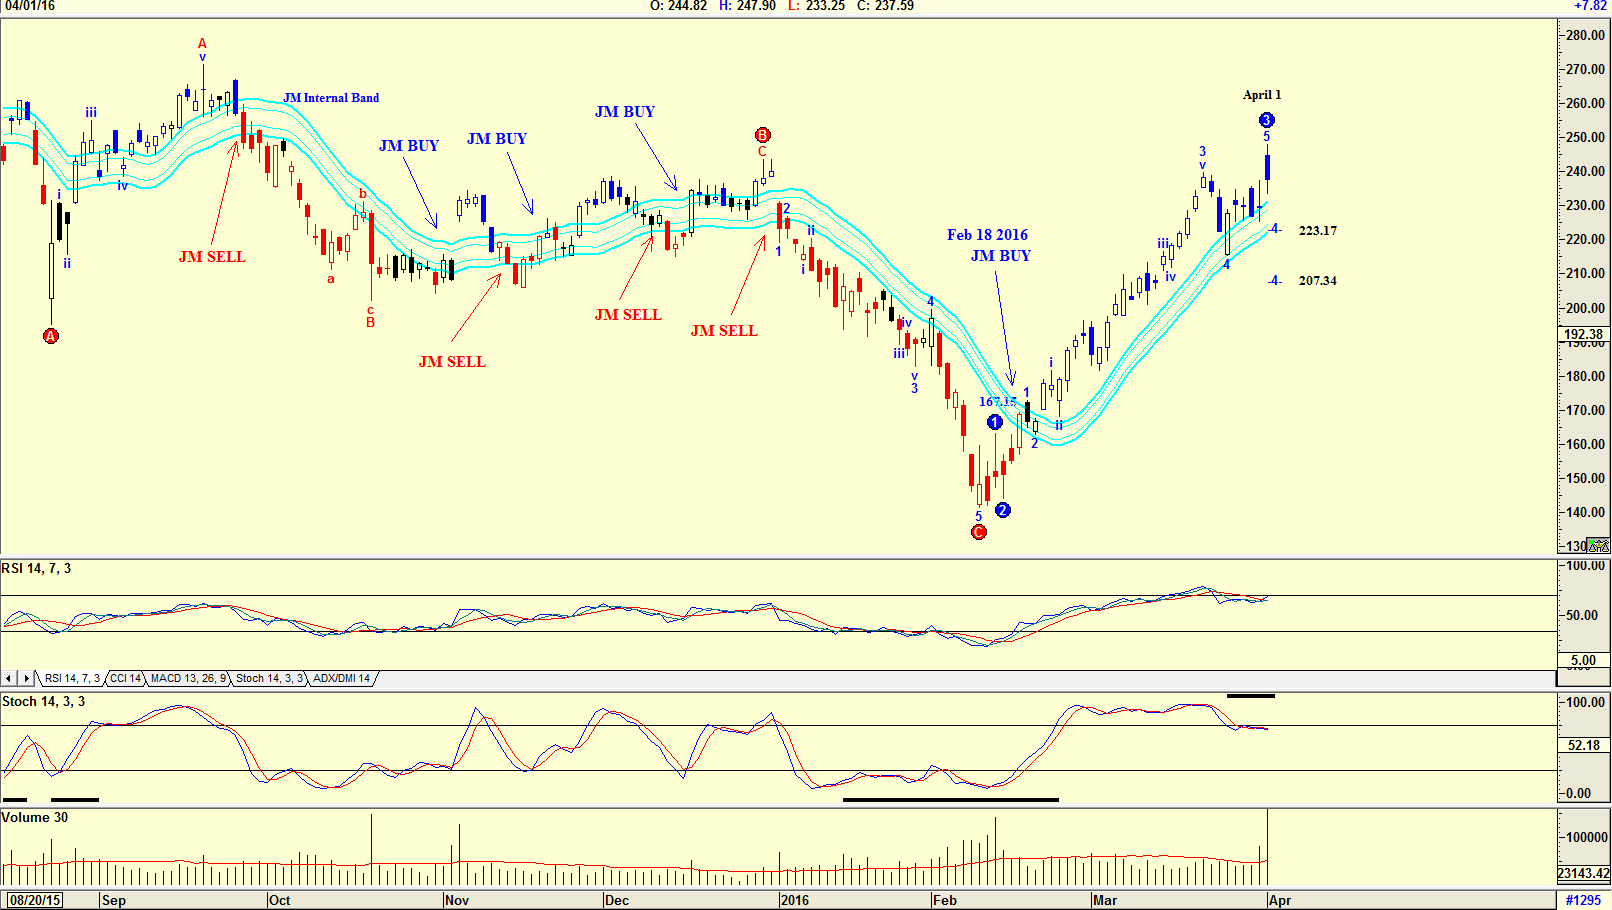
| Figure 3. Daily Tesla chart with Elliott wave count suggesting a correction. |
| Graphic provided by: AdvancedGET. |
| |
| The daily chart in Figure 3 shows an Elliott wave count suggesting that the share price should now correct in a WAVE 4 to either $223.17 or $207.34. The RSI 14 indicator and Stochastic 14 indicator are both suggesting weakness. Note the increase in volume as the share price rose strongly on April 1st with Elon Musk's announcement of the Tesla Model 3. Do note the Candlestick of April 1st, which is black, suggesting that the share price rose to a high of $247.90, fell to a low of $233.25 and closed at $237.59, a figure close to the low. The candlestick therefore suggested caution. The JM Internal Band suggested a BUY on February 18th, 2016, when the share price was $167 15. The JM Internal Band shown on the chart is a 15 period simple moving average offset by 2% plus and 2% minus. A move above the upper band suggests a BUY, and below the lower band, a sell. The charts are suggesting that rather than buying Tesla shares at the current price, one should wait for the indicators to be at oversold levels. With Tesla's history of not being on time for delivery of its motor cars, the company could experience economic uncertainty before delivery of its pre-ordered cars. The Model 3's attainability is what partially drove the hype. It was as if Elon Musk was whispering, "You can own the future." The question is now: Can Tesla deliver? If it does and meets its target date, the share price will start rising strongly. |
Has been a technical analyst since 1969, and has worked as a futures and options trader with First Financial Futures in Johannesburg, South Africa.
| Address: | 3256 West 24th Ave |
| Vancouver, BC | |
| Phone # for sales: | 6042634214 |
| E-mail address: | petroosp@gmail.com |
Click here for more information about our publications!
PRINT THIS ARTICLE

|

Request Information From Our Sponsors
- StockCharts.com, Inc.
- Candle Patterns
- Candlestick Charting Explained
- Intermarket Technical Analysis
- John Murphy on Chart Analysis
- John Murphy's Chart Pattern Recognition
- John Murphy's Market Message
- MurphyExplainsMarketAnalysis-Intermarket Analysis
- MurphyExplainsMarketAnalysis-Visual Analysis
- StockCharts.com
- Technical Analysis of the Financial Markets
- The Visual Investor
- VectorVest, Inc.
- Executive Premier Workshop
- One-Day Options Course
- OptionsPro
- Retirement Income Workshop
- Sure-Fire Trading Systems (VectorVest, Inc.)
- Trading as a Business Workshop
- VectorVest 7 EOD
- VectorVest 7 RealTime/IntraDay
- VectorVest AutoTester
- VectorVest Educational Services
- VectorVest OnLine
- VectorVest Options Analyzer
- VectorVest ProGraphics v6.0
- VectorVest ProTrader 7
- VectorVest RealTime Derby Tool
- VectorVest Simulator
- VectorVest Variator
- VectorVest Watchdog
