HOT TOPICS LIST
- MACD
- Fibonacci
- RSI
- Gann
- ADXR
- Stochastics
- Volume
- Triangles
- Futures
- Cycles
- Volatility
- ZIGZAG
- MESA
- Retracement
- Aroon
INDICATORS LIST
LIST OF TOPICS
PRINT THIS ARTICLE
by Matt Blackman
Agilent (A - NYSE) is on the move again but this time it looks to be heading upward.
Position: N/A
Matt Blackman
Matt Blackman is a full-time technical and financial writer and trader. He produces corporate and financial newsletters, and assists clients in getting published in the mainstream media. He is the host of TradeSystemGuru.com. Matt has earned the Chartered Market Technician (CMT) designation. Find out what stocks and futures Matt is watching on Twitter at www.twitter.com/RatioTrade
PRINT THIS ARTICLE
HEAD & SHOULDERS
Agilent Showing Signs of a Bottom
11/22/02 08:44:48 AMby Matt Blackman
Agilent (A - NYSE) is on the move again but this time it looks to be heading upward.
Position: N/A
| High volumes and wide price swings in the last 24 months have made Agilent Technologies (A-NYSE) a perennial favorite among traders. For the most part, however, the dominant trend has been negative. |
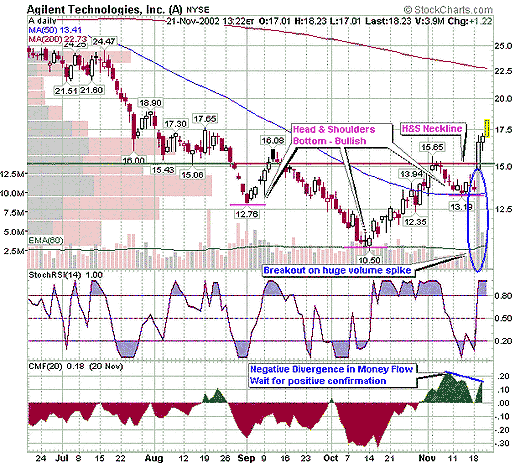
| A head & shoulders bottom pattern that began to take shape in late August 2002 has been confirmed as the stock decisively broke through its neckline on November 19. Making the move even more bullish, it did so on extreme volume (see figure 1). Another bullish sign is that the stock has been trading above its 50-day moving average since November 1 and that this resistance held on November 14 (blue line). It is the first time the stock has traded above this moving average since April 2002. |

|
| Figure 1 – Daily chart of Agilent Technologies showing bullish head & shoulders bottom pattern. |
| Graphic provided by: StockCharts.com. |
| |
| It would be healthy for the stock to consolidate from its breakout. A settlement back to the neckline at around $15.60-16.00, would provide further confirmation of the head & shoulders pattern and give the stock a good point to mount a strong advance. It would also be encouraging to see positive confirmation in the Chaikin Money Flow (CMF), which was showing negative divergence with price on the breakout, to insure that the move is not short-term. An increase in the CMF would show that money is continuing to move into this equity. |
| A return to an oversold (<20) or at least neutral stochastic RSI reading (around 50) would also be encouraging to traders as it would show that the next leg of the move upwards has a good foundation. In a strong uptrend, stochastic RSI values often remain in overbought territory (>80) as the indicator is an oscillator and works less well in a trend. However, it can still provide good entry points by indicating that a retracement has occurred. |
| All this, of course, depends on continued bullishness in the Nasdaq from this point, which is at a critical juncture. |
Matt Blackman is a full-time technical and financial writer and trader. He produces corporate and financial newsletters, and assists clients in getting published in the mainstream media. He is the host of TradeSystemGuru.com. Matt has earned the Chartered Market Technician (CMT) designation. Find out what stocks and futures Matt is watching on Twitter at www.twitter.com/RatioTrade
| Company: | TradeSystemGuru.com |
| Address: | Box 2589 |
| Garibaldi Highlands, BC Canada | |
| Phone # for sales: | 604-898-9069 |
| Fax: | 604-898-9069 |
| Website: | www.tradesystemguru.com |
| E-mail address: | indextradermb@gmail.com |
Traders' Resource Links | |
| TradeSystemGuru.com has not added any product or service information to TRADERS' RESOURCE. | |
Click here for more information about our publications!
PRINT THIS ARTICLE

Request Information From Our Sponsors
- StockCharts.com, Inc.
- Candle Patterns
- Candlestick Charting Explained
- Intermarket Technical Analysis
- John Murphy on Chart Analysis
- John Murphy's Chart Pattern Recognition
- John Murphy's Market Message
- MurphyExplainsMarketAnalysis-Intermarket Analysis
- MurphyExplainsMarketAnalysis-Visual Analysis
- StockCharts.com
- Technical Analysis of the Financial Markets
- The Visual Investor
- VectorVest, Inc.
- Executive Premier Workshop
- One-Day Options Course
- OptionsPro
- Retirement Income Workshop
- Sure-Fire Trading Systems (VectorVest, Inc.)
- Trading as a Business Workshop
- VectorVest 7 EOD
- VectorVest 7 RealTime/IntraDay
- VectorVest AutoTester
- VectorVest Educational Services
- VectorVest OnLine
- VectorVest Options Analyzer
- VectorVest ProGraphics v6.0
- VectorVest ProTrader 7
- VectorVest RealTime Derby Tool
- VectorVest Simulator
- VectorVest Variator
- VectorVest Watchdog
