

HOT TOPICS LIST
- MACD
- Fibonacci
- RSI
- Gann
- ADXR
- Stochastics
- Volume
- Triangles
- Futures
- Cycles
- Volatility
- ZIGZAG
- MESA
- Retracement
- Aroon
INDICATORS LIST
LIST OF TOPICS
PRINT THIS ARTICLE
by Stella Osoba, CMT
The endowment effect is a bias which accounts for why traders and investors will sometimes allow themselves to get married to a position.
Position: N/A
Stella Osoba, CMT
Stella Osoba is a trader and financial writer. She is a frequent contributor to "Technical Analysis of Stocks and Commodities" magazine and "Traders.com Advantage" as well as other financial publications.
PRINT THIS ARTICLE
PSYCHOLOGY
The Endowment Effect
04/06/16 01:40:08 PMby Stella Osoba, CMT
The endowment effect is a bias which accounts for why traders and investors will sometimes allow themselves to get married to a position.
Position: N/A
| Studies have shown that we often place far more value on things we own than on things we do not own. In one well known experiment, it was found that when mugs with university insignias were given to a random group of people, they were unwilling to part with the mugs for the amount those same mugs could be bought for elsewhere. Instead, the participants in the experiment demanded a sum equivalent to double the current price of the mugs to part with them. The owners of the mugs had assigned an increased value to the mugs simply because they owned them. This is known as the endowment effect. |
| A similar occurrence can be found amongst some owners of stocks. Traders and investors may find themselves unwilling to part with stocks they might have inherited or become fond of for other reasons. When this happens, they lose sight of the reason they have the stock in the first place. They therefore fail to act appropriately when the stock underperforms and instead will justify their reason for holding onto the stock with explanations which have nothing to do with price. |
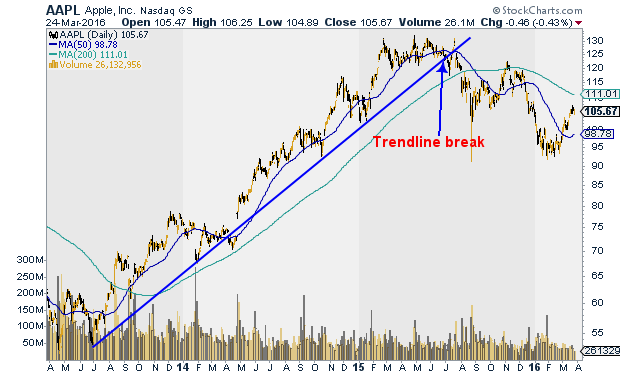
| Take for instance the stock of Apple (AAPL) which for much of 2014 and 2015 outperformed the S&P 500 and even went parabolic at times. AAPL was the darling of investors and the stock could seemingly do no wrong. It was constantly breaking to new highs and outperforming. But a look at Figure 1 will show that since the break of its long term trendline in July 2015, its performance has been rather less spectacular. |
|
| Figure 1. AAPL Daily with a trendline break last year. |
| Graphic provided by: StockCharts.com. |
| |
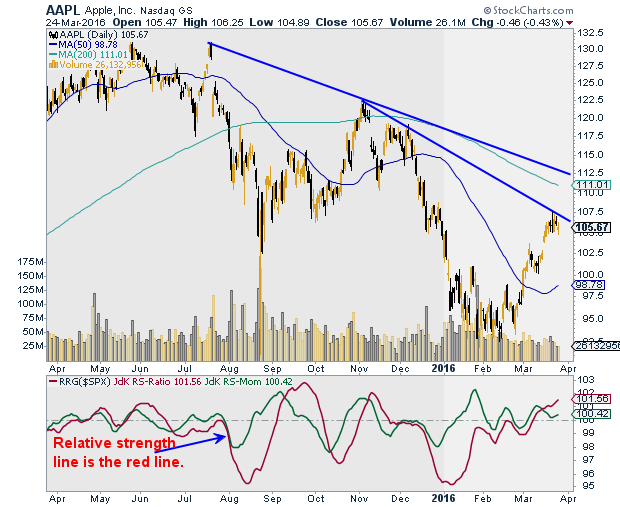
| In Figure 2, the RRG Relative Strength indicator compares the relative performance of AAPL with the performance of the S&P 500 ($SPY). The red line measures the relative performance of one security against another, while the green line measures momentum of the RS ratio. We will focus here on the red line or on relative strength. When the red line is below 100, it means that the stock is showing poorer relative strength performance than the index it is being compared to; in this case, the S&P 500 as a proxy for the market. Since July 2015, the red line has spent much of the time below the 100 line. This means that during this period, AAPL has largely under-performed the S&P 500 index. |
|
| Figure 2. AAPL daily with the RRG indicator showing the stock's strenght vs. the S&P 500. |
| Graphic provided by: StockCharts.com. |
| |
| There is nothing wrong with holding an under-performing stock as part of a well thought out strategy. But when the justification for holding the stock is an inability to separate yourself from the position, beware. |
Stella Osoba is a trader and financial writer. She is a frequent contributor to "Technical Analysis of Stocks and Commodities" magazine and "Traders.com Advantage" as well as other financial publications.
| E-mail address: | stellaosoba@gmail.com |
Click here for more information about our publications!
PRINT THIS ARTICLE

Request Information From Our Sponsors
- StockCharts.com, Inc.
- Candle Patterns
- Candlestick Charting Explained
- Intermarket Technical Analysis
- John Murphy on Chart Analysis
- John Murphy's Chart Pattern Recognition
- John Murphy's Market Message
- MurphyExplainsMarketAnalysis-Intermarket Analysis
- MurphyExplainsMarketAnalysis-Visual Analysis
- StockCharts.com
- Technical Analysis of the Financial Markets
- The Visual Investor
- VectorVest, Inc.
- Executive Premier Workshop
- One-Day Options Course
- OptionsPro
- Retirement Income Workshop
- Sure-Fire Trading Systems (VectorVest, Inc.)
- Trading as a Business Workshop
- VectorVest 7 EOD
- VectorVest 7 RealTime/IntraDay
- VectorVest AutoTester
- VectorVest Educational Services
- VectorVest OnLine
- VectorVest Options Analyzer
- VectorVest ProGraphics v6.0
- VectorVest ProTrader 7
- VectorVest RealTime Derby Tool
- VectorVest Simulator
- VectorVest Variator
- VectorVest Watchdog