HOT TOPICS LIST
- MACD
- Fibonacci
- RSI
- Gann
- ADXR
- Stochastics
- Volume
- Triangles
- Futures
- Cycles
- Volatility
- ZIGZAG
- MESA
- Retracement
- Aroon
INDICATORS LIST
LIST OF TOPICS
PRINT THIS ARTICLE
by Koos van der Merwe
When a share price keeps rising, do you simply buy the share?
Position: Sell
Koos van der Merwe
Has been a technical analyst since 1969, and has worked as a futures and options trader with First Financial Futures in Johannesburg, South Africa.
PRINT THIS ARTICLE
ELLIOTT WAVE
Adobe Systems, Inc.
03/30/16 11:35:52 AMby Koos van der Merwe
When a share price keeps rising, do you simply buy the share?
Position: Sell
| Adobe Systems Incorporated is an American transnational computer software company headquartered in San Jose, California. The company focuses on the creation of multimedia and creativity software products and is best known for Photoshop, Adobe Reader, Adobe Creative Suite and Adobe Creative Cloud. On March 17th, 2016, the company announced profit for its first quarter. The company announced that its bottom line had advanced to $0.66 per share compared to $0.44 per share in the first quarter of 2015. With the profits of the company strengthening to this extent, is the share a buy? |

|
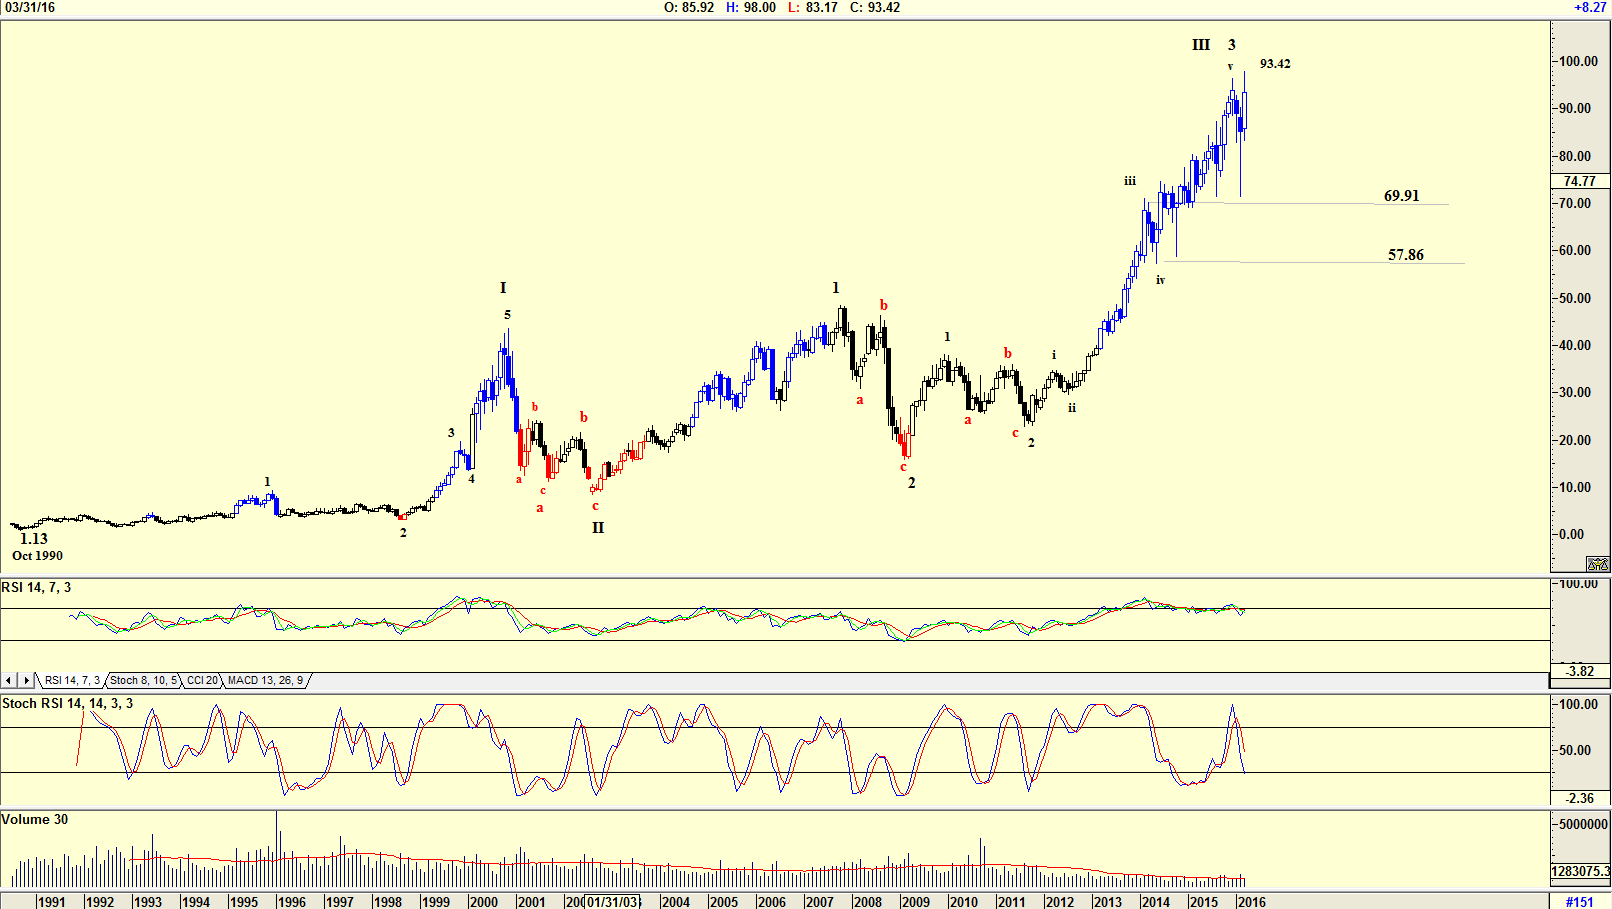
| Figure 1. Monthly chart of Adobe with Elliott wave count. |
| Graphic provided by: AdvancedGET. |
| |
| The chart in Figure 1 is a monthly chart showing how the share price has risen from a low of $1.13 in October 1990 to its current high of $93.42. The Elliott wave count is suggesting that the share price could be completing a wave 3 of WAVE III. This suggests that a WAVE IV is in the offing. A fourth wave usually falls to the 4th wave of lesser degree, which means that the price could fall, if the wave count is correct, to somewhere between $69.91 and $57.86. Volume as the share rose in WAVE III has been below average and with the RSI indicator at overbought levels and the Stochastic RSI indicator having given a sell signal, one could expect the share price to correct. |

|
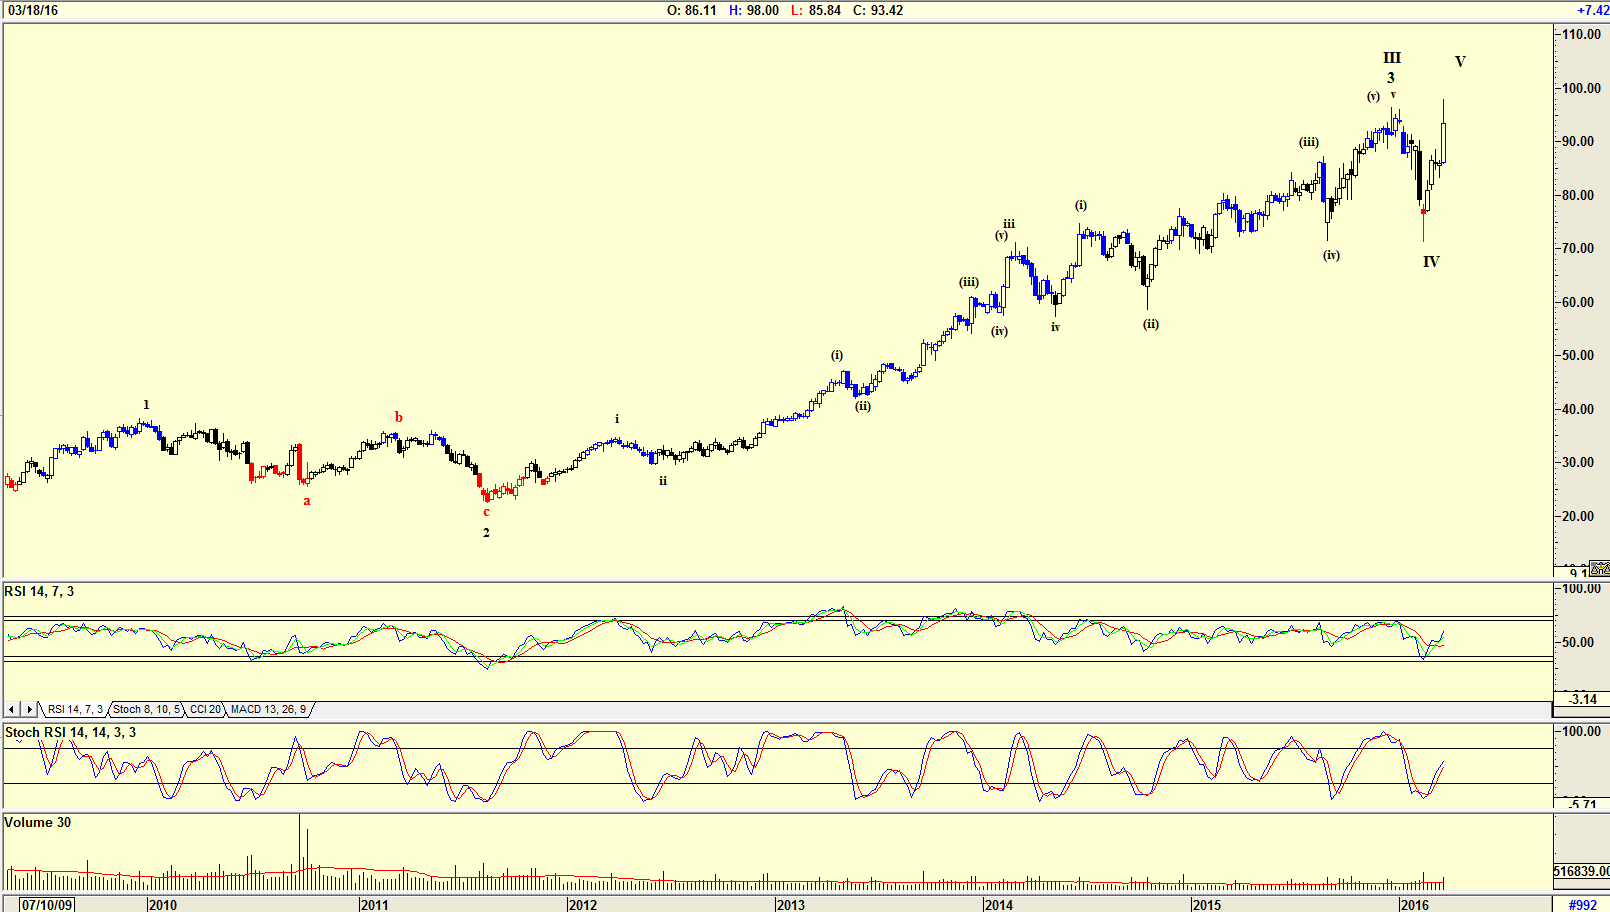
| Figure 2. Weekly Chart of Adobe with Elliott wave count. |
| Graphic provided by: AdvancedGET. |
| |
| The weekly chart in Figure 2 shows an Elliott wave count that confirms that the share price could have completed the WAVE IV correction, and could now be in WAVE V. This is confirmed by the two indicators which are both trending upwards after giving buy signals. Volume on the recent rise rose with the share price, suggesting strength. |

|
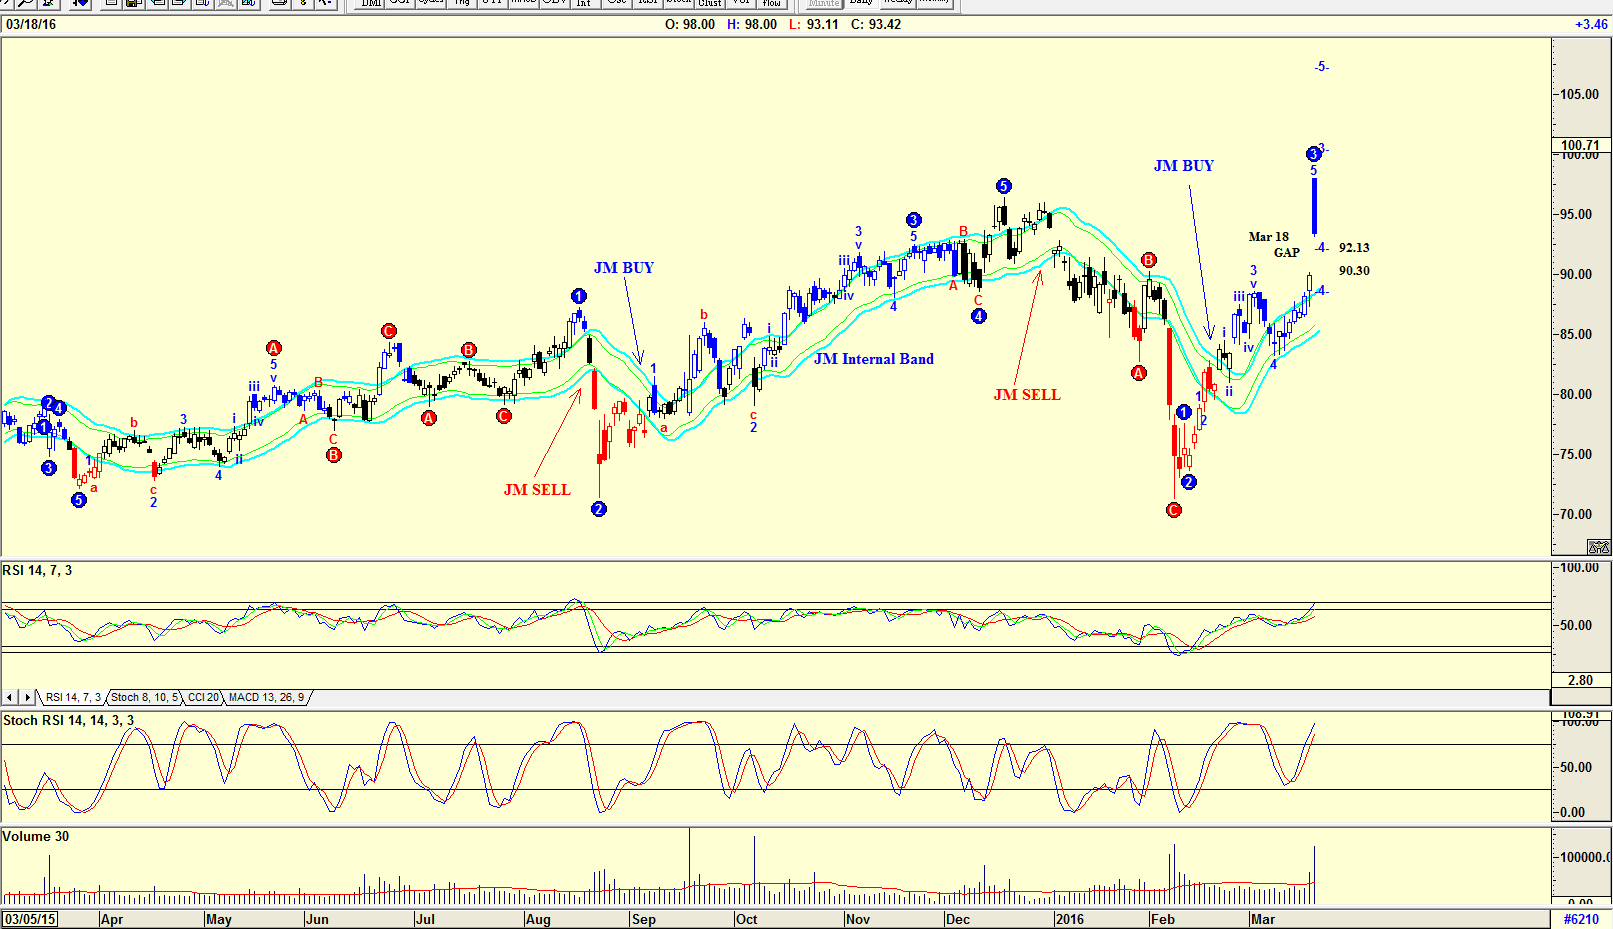
| Figure 3. Daily chart of ADBE with Elliott wave count and JM Internal Band. |
| Graphic provided by: AdvancedGET. |
| |
| The daily chart in Figure 3 shows and Advanced GET Elliott wave count with the share price possibly in a Wave 3. With the gap that formed on March 18th as the share price rose strongly, the probability of the price falling to fill the gap is very possible. With both the RSI indicator and the Stochastic RSI indicator at overbought levels, this could indeed happen in the near future. Do note that volume rose as the share price rose, confirming strength. A rise in a share price with strong volume suggests strength. A rise in the shares price on falling volume suggests weakness. The JM Internal Band is still suggesting a buy. A JM Internal Band is a simple 15 period moving average offset by 2% positive and 2% negative. A break above the upper band suggests a buy, and below the lower band, a sell. The strategy is used successfully by conservative investors. Personally, I would not be a buyer of ADOBE shares at the current price, but would wait for the share price to fall to fill the gap, and for the two indicators to fall to oversold levels. The price could well fall to give a JM Internal Band sell, and this is something to watch carefully. Once the indicators have given a buy, I would expect the share price to rise to the suggested Wave 5 shown on the chart. |
Has been a technical analyst since 1969, and has worked as a futures and options trader with First Financial Futures in Johannesburg, South Africa.
| Address: | 3256 West 24th Ave |
| Vancouver, BC | |
| Phone # for sales: | 6042634214 |
| E-mail address: | petroosp@gmail.com |
Click here for more information about our publications!
PRINT THIS ARTICLE

Request Information From Our Sponsors
- StockCharts.com, Inc.
- Candle Patterns
- Candlestick Charting Explained
- Intermarket Technical Analysis
- John Murphy on Chart Analysis
- John Murphy's Chart Pattern Recognition
- John Murphy's Market Message
- MurphyExplainsMarketAnalysis-Intermarket Analysis
- MurphyExplainsMarketAnalysis-Visual Analysis
- StockCharts.com
- Technical Analysis of the Financial Markets
- The Visual Investor
- VectorVest, Inc.
- Executive Premier Workshop
- One-Day Options Course
- OptionsPro
- Retirement Income Workshop
- Sure-Fire Trading Systems (VectorVest, Inc.)
- Trading as a Business Workshop
- VectorVest 7 EOD
- VectorVest 7 RealTime/IntraDay
- VectorVest AutoTester
- VectorVest Educational Services
- VectorVest OnLine
- VectorVest Options Analyzer
- VectorVest ProGraphics v6.0
- VectorVest ProTrader 7
- VectorVest RealTime Derby Tool
- VectorVest Simulator
- VectorVest Variator
- VectorVest Watchdog
