

HOT TOPICS LIST
- MACD
- Fibonacci
- RSI
- Gann
- ADXR
- Stochastics
- Volume
- Triangles
- Futures
- Cycles
- Volatility
- ZIGZAG
- MESA
- Retracement
- Aroon
INDICATORS LIST
LIST OF TOPICS
PRINT THIS ARTICLE
by Stella Osoba, CMT
Will a break of resistance negate AutoZone's long term trend line break?
Position: N/A
Stella Osoba, CMT
Stella Osoba is a trader and financial writer. She is a frequent contributor to "Technical Analysis of Stocks and Commodities" magazine and "Traders.com Advantage" as well as other financial publications.
PRINT THIS ARTICLE
STOCKS
Is AutoZone Still a Strong Long Play?
03/23/16 10:49:19 AMby Stella Osoba, CMT
Will a break of resistance negate AutoZone's long term trend line break?
Position: N/A
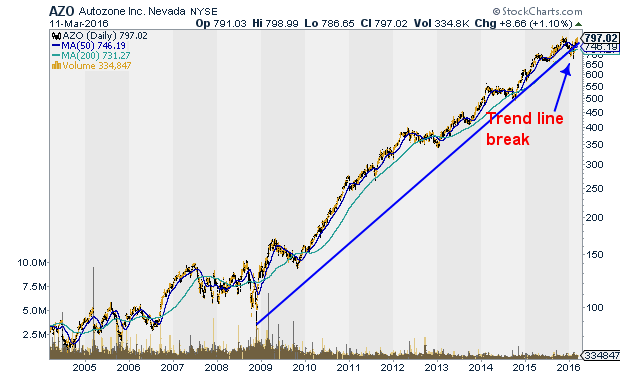
| Autozone (AZO), the automotive parts and accessories retailer and distributor, has been in a long term uptrend since its low on November 20, 2008 when it closed at $89.09, finding support at its July 2006 lows. On March 11, 2016, the stock closed up $8.66 at $797.02. But a look under the bonnet of this shooting star shows that some caution may be in order when assessing the stock for a new long play. |
| A long term chart of AZO will show this star performer making a series of higher highs in its long stellar history (See Figure 1). But closer scrutiny will reveal there have been significant periods of time during this uptrend when the stock failed to outperform. For most of 2009, AZO stayed in a downward sloping channel only breaking out of the channel on November 20, 2009. In 2012 it stayed in a trading range for the entire year, only successfully breaking out of the range in April of the following year. Then in 2015, price did not advance beyond April's highs until August. |
|
| Figure 1. Daily chart for AZO showing long term trend line break. |
| Graphic provided by: StockCharts.com. |
| |
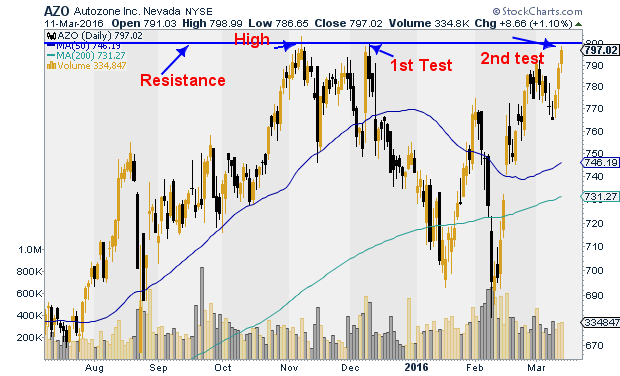
| Now, with AZO breaking its longterm uptrend line, is the stock headed for the kind of periods of underperformance it has seen in the past? With its up close on March 11, 2016, AZO looks set in the coming days to make a second retest of its November 6, 2015 high of 803.25 (See Figure 2). The first test of the high was on December 9, 2015 when the stock reached 800.89, but failed to reach or surpass the previous high. A decisive close above 804 on strong volume would be positive for the stock and could spell a continuation of the uptrend. But breaks of long term trend lines should never be ignored. Vigilance is necessary to see if the price action reveals that AZO is about to go through another period of underperformance. |
|
| Figure 2. AZO Daily. With the recent upswing AZO is approaching long term resistance. |
| Graphic provided by: StockCharts.com. |
| |
| As always, be extra cautious when a stock begins to show signs of stalling momentum coupled with decisive breaks of longterm trend lines. |
Stella Osoba is a trader and financial writer. She is a frequent contributor to "Technical Analysis of Stocks and Commodities" magazine and "Traders.com Advantage" as well as other financial publications.
| E-mail address: | stellaosoba@gmail.com |
Click here for more information about our publications!
PRINT THIS ARTICLE

Request Information From Our Sponsors
- StockCharts.com, Inc.
- Candle Patterns
- Candlestick Charting Explained
- Intermarket Technical Analysis
- John Murphy on Chart Analysis
- John Murphy's Chart Pattern Recognition
- John Murphy's Market Message
- MurphyExplainsMarketAnalysis-Intermarket Analysis
- MurphyExplainsMarketAnalysis-Visual Analysis
- StockCharts.com
- Technical Analysis of the Financial Markets
- The Visual Investor
- VectorVest, Inc.
- Executive Premier Workshop
- One-Day Options Course
- OptionsPro
- Retirement Income Workshop
- Sure-Fire Trading Systems (VectorVest, Inc.)
- Trading as a Business Workshop
- VectorVest 7 EOD
- VectorVest 7 RealTime/IntraDay
- VectorVest AutoTester
- VectorVest Educational Services
- VectorVest OnLine
- VectorVest Options Analyzer
- VectorVest ProGraphics v6.0
- VectorVest ProTrader 7
- VectorVest RealTime Derby Tool
- VectorVest Simulator
- VectorVest Variator
- VectorVest Watchdog