HOT TOPICS LIST
- MACD
- Fibonacci
- RSI
- Gann
- ADXR
- Stochastics
- Volume
- Triangles
- Futures
- Cycles
- Volatility
- ZIGZAG
- MESA
- Retracement
- Aroon
INDICATORS LIST
LIST OF TOPICS
PRINT THIS ARTICLE
by Koos van der Merwe
When a market starts suggesting negativity, looking for a safe investment becomes a must.
Position: Accumulate
Koos van der Merwe
Has been a technical analyst since 1969, and has worked as a futures and options trader with First Financial Futures in Johannesburg, South Africa.
PRINT THIS ARTICLE
TECHNICAL ANALYSIS
Looking At Canadian Bonds
03/23/16 10:58:44 AMby Koos van der Merwe
When a market starts suggesting negativity, looking for a safe investment becomes a must.
Position: Accumulate
| Too many investment advisors are suggesting that the market will start correcting heavily sometime in the future. I am one of them, because my charts are suggesting that the Indexes are in a major WAVE V up. If this is the case, one should never forget the maxim, "When in doubt, get out!" So, where do you put your money when you do get out, besides putting it under the mattress? Many look to Gold shares for the answer. Others look to dividend and interest bearing stocks. Many go the cautious route, and buy GIC's. One product to look at is the i-Unit Canadian Bond (XBB). With the Canadian Dollar starting to strengthen against the US$, this may be the way to go. |

|
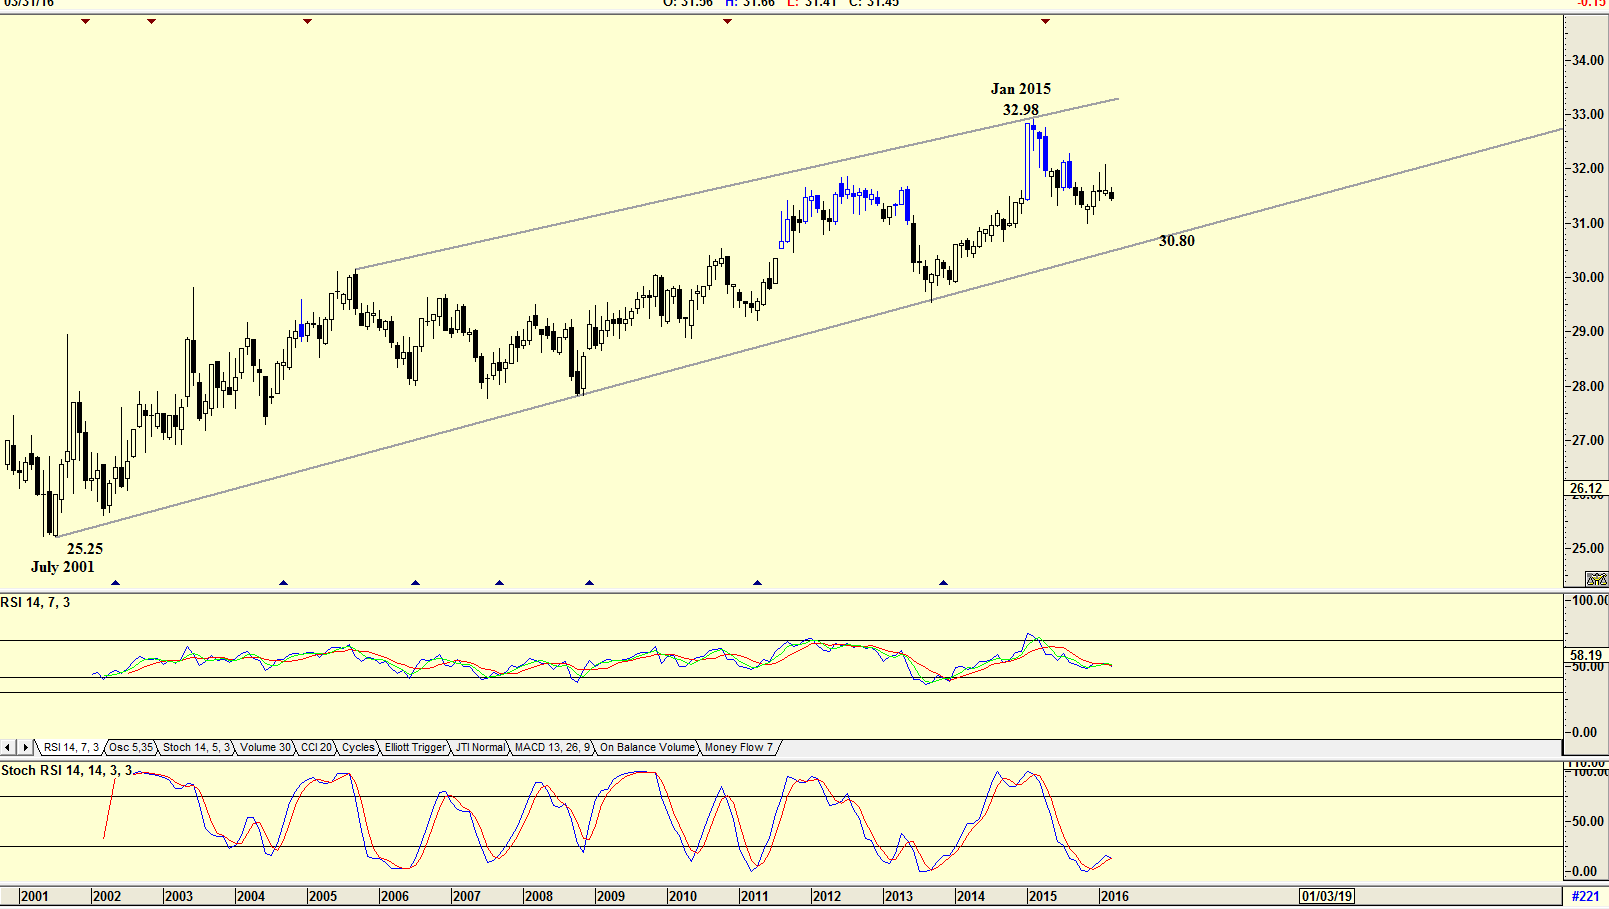
| Figure 1. Monthly chart showing the trend. |
| Graphic provided by: AdvancedGET. |
| |
| The chart in Figure 1 is a monthly chart of the i-Unit Canadian Universe Bond. The chart shows how the i-unit has moved up from a low of $25.25 in January 2001 to a high of $32.98 by January 2015, not a great increase in value, but a safe increase. Interest paid by the Bond is not that wonderful, but combined with the rising strength of the Canadian dollar, it could be a good and comfortable investment. Do note the RSI and RSI Stochastic indicators shown. The RSI indicator is trending downwards, suggesting weakness, but the Stochastic RSI indicator is at oversold levels, but has not yet given a buy signal. The i-Unit could fall to the support line at approximately the $30.80 level. |

|
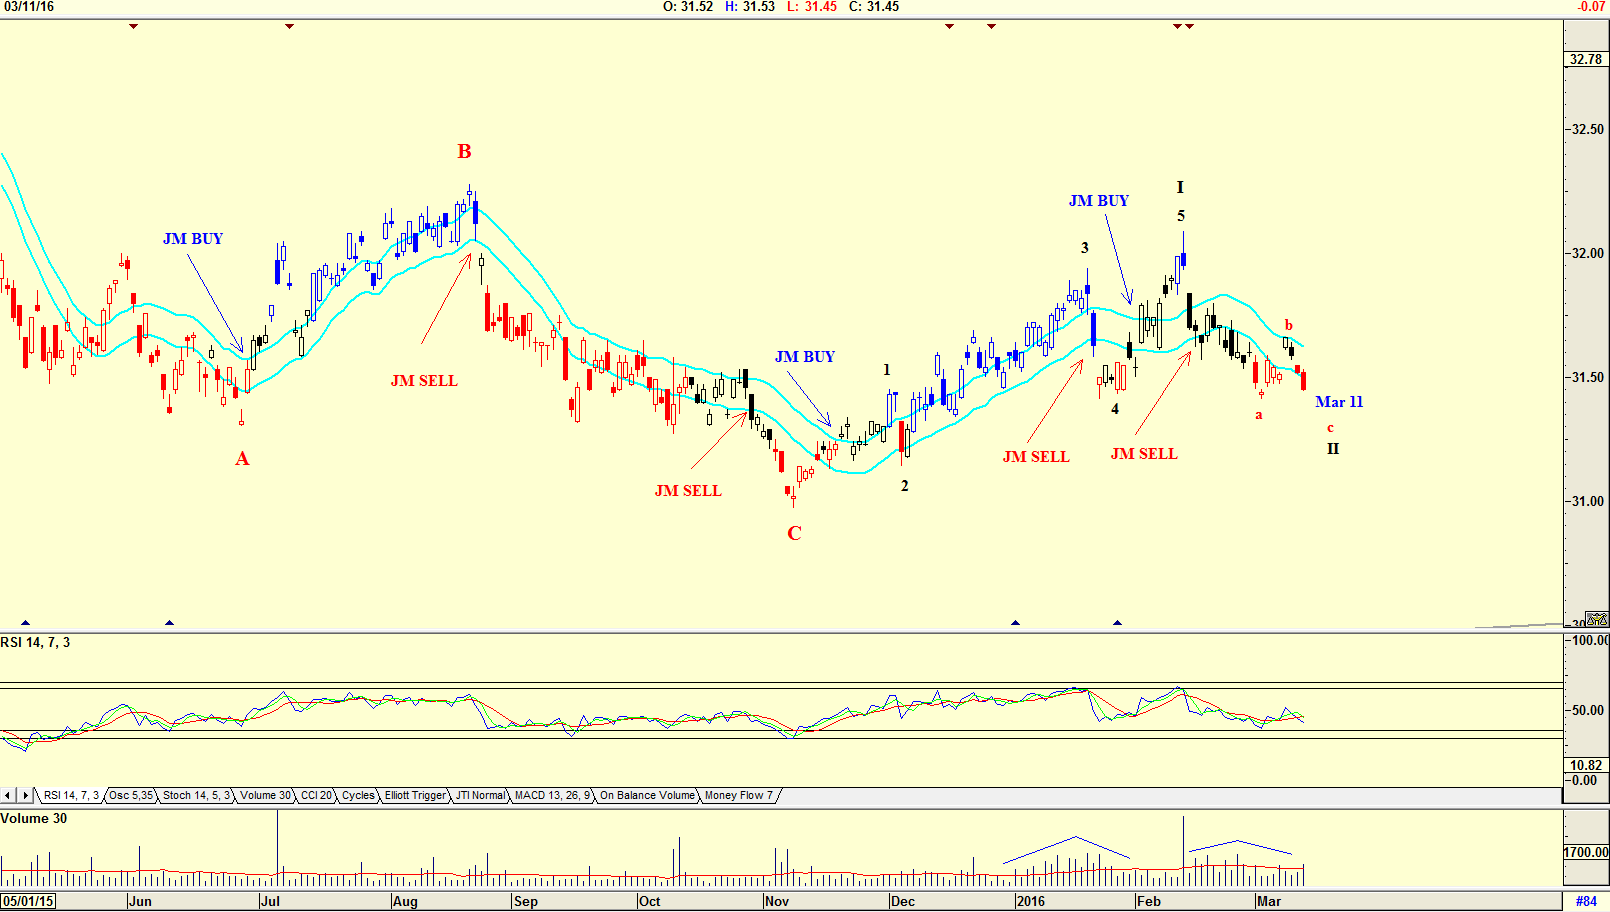
| Figure 2. Daily chart with Elliott wave count. |
| Graphic provided by: AdvancedGET. |
| |
| The chart in Figure 2 is a daily chart with a JM Internal Band indicator. The JM Internal Band is a 15 period simple moving average offset by 2% plus and 2% minus. A break above the upper band suggests a buy and below the lower band a sell. On this chart however, the offset is 0.2% positive and 0.2% negative. The chart is showing that the i-Unit is still a JM sell. The RSI indicator is still trending down. Do note the volume, which rose as the price fell on March 11th, a sign of weakness. Also note the Elliott wave count which is suggesting a Wave II bottom could be developing. Owning equities is riskier than owning fixed income investments like bonds or GIC's, cash or cash-like investments such as money market funds and Treasury bills. One could also look to mutual funds for safety, however must not forget that in the world of mutual funds, risk can be quantified in terms of the volatility of the fund. How much risk one can tolerate is most important. Setting up an investment portfolio that is well diversified, tax efficient, that meets your long-term financial goals and above all, your risk comfort goal is a must, which is why a Canadian Bond could be the answer. |
Has been a technical analyst since 1969, and has worked as a futures and options trader with First Financial Futures in Johannesburg, South Africa.
| Address: | 3256 West 24th Ave |
| Vancouver, BC | |
| Phone # for sales: | 6042634214 |
| E-mail address: | petroosp@gmail.com |
Click here for more information about our publications!
PRINT THIS ARTICLE

Request Information From Our Sponsors
- StockCharts.com, Inc.
- Candle Patterns
- Candlestick Charting Explained
- Intermarket Technical Analysis
- John Murphy on Chart Analysis
- John Murphy's Chart Pattern Recognition
- John Murphy's Market Message
- MurphyExplainsMarketAnalysis-Intermarket Analysis
- MurphyExplainsMarketAnalysis-Visual Analysis
- StockCharts.com
- Technical Analysis of the Financial Markets
- The Visual Investor
- VectorVest, Inc.
- Executive Premier Workshop
- One-Day Options Course
- OptionsPro
- Retirement Income Workshop
- Sure-Fire Trading Systems (VectorVest, Inc.)
- Trading as a Business Workshop
- VectorVest 7 EOD
- VectorVest 7 RealTime/IntraDay
- VectorVest AutoTester
- VectorVest Educational Services
- VectorVest OnLine
- VectorVest Options Analyzer
- VectorVest ProGraphics v6.0
- VectorVest ProTrader 7
- VectorVest RealTime Derby Tool
- VectorVest Simulator
- VectorVest Variator
- VectorVest Watchdog
