HOT TOPICS LIST
- MACD
- Fibonacci
- RSI
- Gann
- ADXR
- Stochastics
- Volume
- Triangles
- Futures
- Cycles
- Volatility
- ZIGZAG
- MESA
- Retracement
- Aroon
INDICATORS LIST
LIST OF TOPICS
PRINT THIS ARTICLE
by Koos van der Merwe
Where is the market going from here?
Position: Sell
Koos van der Merwe
Has been a technical analyst since 1969, and has worked as a futures and options trader with First Financial Futures in Johannesburg, South Africa.
PRINT THIS ARTICLE
ELLIOTT WAVE
What Does The Russel 2000 Index Tell Us?
03/17/16 01:07:04 PMby Koos van der Merwe
Where is the market going from here?
Position: Sell
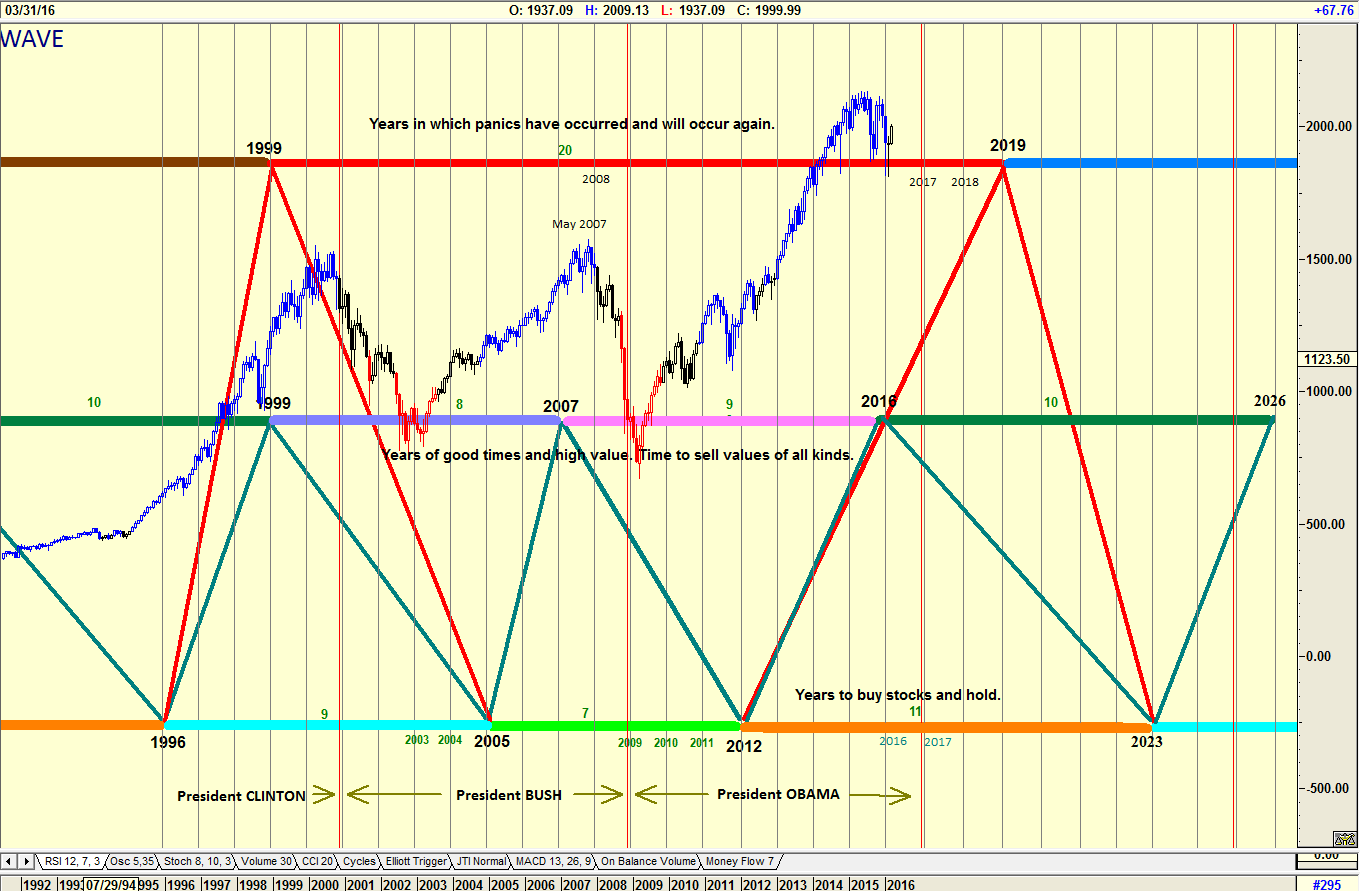
| With Mitt Romney in a long, detailed and passionate speech stating that Donald Trump is a "phony, a fraud" and that should he become President of the United States of America, the country will enter a recession, what do the charts say? We all know that the Kondratieff Wave is calling for an economic recession starting in 2016 and lasting until the year 2023, but is this because Donald Trump will be elected President of the United States of America, or is there another reason? Technical analysis and economic cycles is not the reason why, so the reason for the coming recession could be anything, from global warming to, once again, bank mismanagement. Only time will tell. |

|
| Figure 1. The Kondratieff Wave. |
| Graphic provided by: AdvancedGET. |
| |
| The chart in Figure 1 is a chart of the Kondratieff Wave prepared by Nikolai Kondratieff in 1925 in his book, "The Major Economic Cycles". The Kondratieff Wave is a forecast of the economic cycle of the world, and predicting a recession lasting until the year 2023. However, the stock market usually watches the K-Wave, as it is more well known, anticipating a correction and recovery and not necessarily acting on the dates suggested. The chart above shows the S&P 500 on the chart, and shows that the S&P 500 started correcting before the K-Wave suggestion of a correction in 2016. Do note the Presidential cycle shown on the chart, where the corrections that occurred with the election of President Bush and President Obama started before either President took office. Is this due to uncertainty over each President's economic policy made public in campaigns or simply a reaction to the K-Wave corrections, where Investors tend to invest in a strong market, not prepared to accept that a correction may occur? |

|
| Figure 2. Weekly chart of the iShares Russell 2000 index. |
| Graphic provided by: AdvancedGET. |
| |
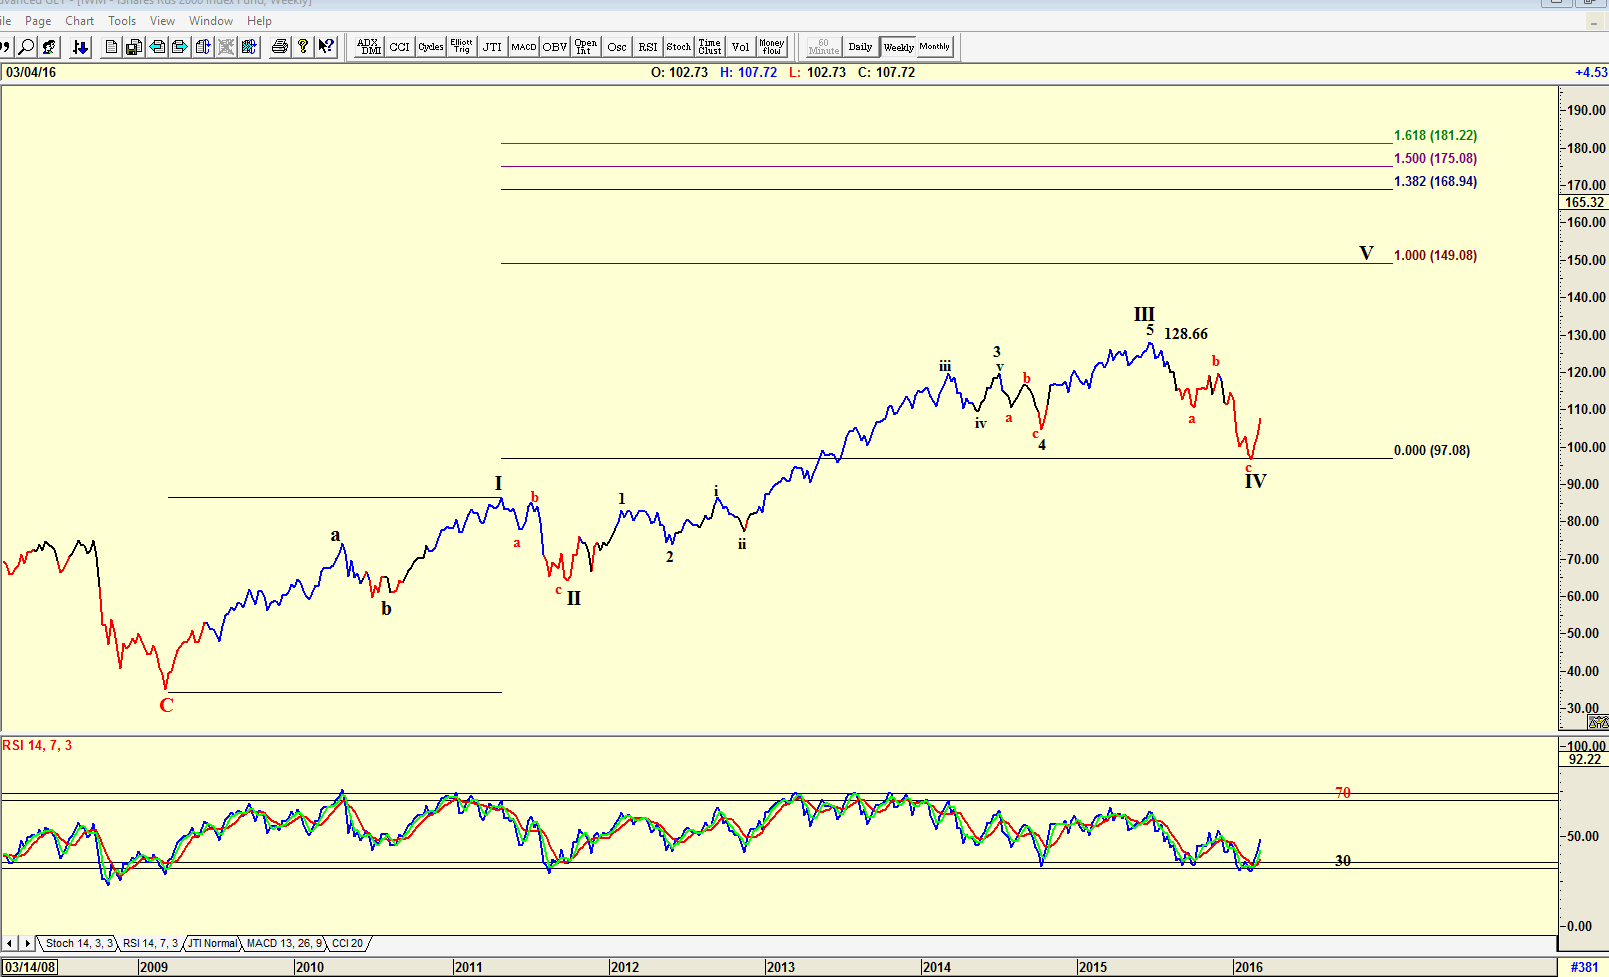
| The chart in Figure 2 is a chart of the weekly iShares Russell 2000 index showing and Elliott wave count that is suggesting the index is completing a WAVE IV and could start rising in a WAVE V. The chart is suggesting that the WAVE V should top out at 149.08. Elliott wave theory suggests that a WAVE V should equal a WAVE I. However, with computers becoming more and more prevalent in stock market trading, WAVE V could well stop out at the WAVE III top of 128.66. The RSI Index is suggesting that the iShares Russell 2000 index should start rising, and as the chart in Figure 1 suggests, only correcting a few months after the correction suggested by the years of good times and high values — which means a few months before the year 2017. |

|
| Figure 3. Daily chart of the iShares Russell 2000 index. |
| Graphic provided by: AdvancedGET. |
| |
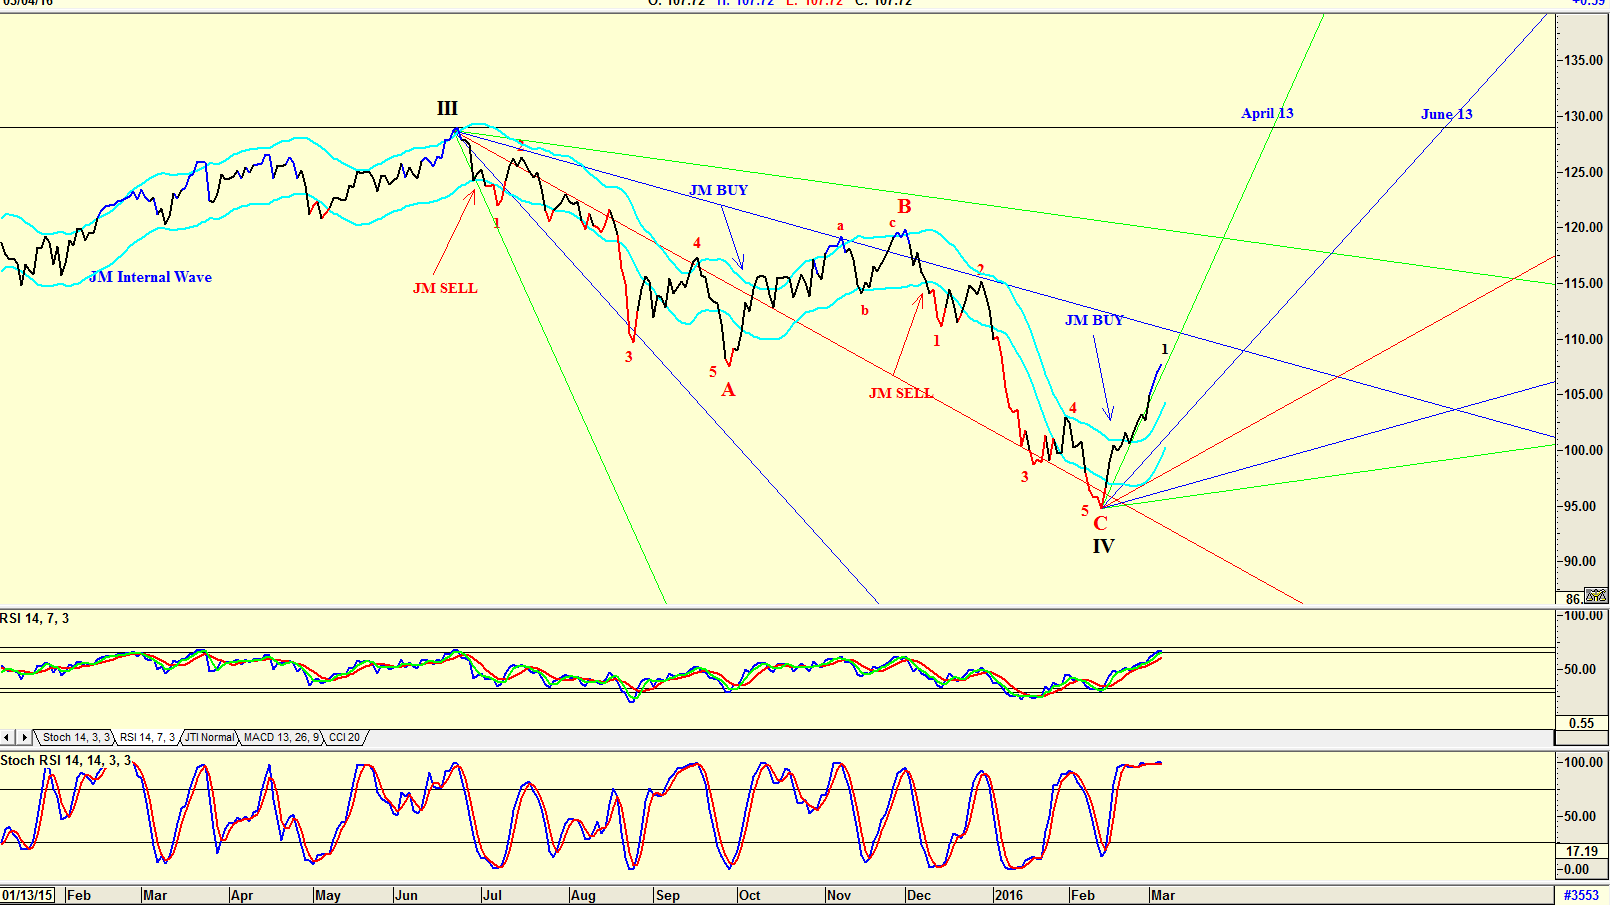
| The chart in Figure 3 is a daily chart of the iShares Russell 2000 index. The chart, as in Figure 2, shows an Elliott wave count suggesting that the iShare could be in a WAVE V trending upward. The RSI and Stochastic RSI indicators are both at overbought levels, suggesting a correction is due. This could be a wave 2 correction of WAVE V. Do note the JM Internal Band showing the iShare is still in a positive position. A JM Internal Band is a 15 period simple moving average offset by 2% positive and 2% negative. A move above the upper band suggests a buy, and below the lower band, a sell. The chart also shows the Gann fan, suggesting possible turning points on April 13 and June 13. Whether these dates are the turning point for Wave 1 and the start of wave 2 is not a certainty. The April 13th turning point could be the bottom of Wave 2 of WAVE V. Whatever they forecast, these dates should be kept in mind as the iShare price approaches them. There is no doubt in my mind that the world economy is entering a recession sometime this year. There will be a "last rise" allowing an investor to sell their investment into strength before parking their money either in gold or under the mattress. Whether the recession in the USA will be caused by the election of Donald Trump as President as suggested by Mitt Romney, or by something else is anybody's guess. Whatever the reason, investors should carefully watch the market, and with trepidation, look for long term safe investments offering a solid yield. |
Has been a technical analyst since 1969, and has worked as a futures and options trader with First Financial Futures in Johannesburg, South Africa.
| Address: | 3256 West 24th Ave |
| Vancouver, BC | |
| Phone # for sales: | 6042634214 |
| E-mail address: | petroosp@gmail.com |
Click here for more information about our publications!
Comments
Date: 03/18/16Rank: 5Comment:

Request Information From Our Sponsors
- VectorVest, Inc.
- Executive Premier Workshop
- One-Day Options Course
- OptionsPro
- Retirement Income Workshop
- Sure-Fire Trading Systems (VectorVest, Inc.)
- Trading as a Business Workshop
- VectorVest 7 EOD
- VectorVest 7 RealTime/IntraDay
- VectorVest AutoTester
- VectorVest Educational Services
- VectorVest OnLine
- VectorVest Options Analyzer
- VectorVest ProGraphics v6.0
- VectorVest ProTrader 7
- VectorVest RealTime Derby Tool
- VectorVest Simulator
- VectorVest Variator
- VectorVest Watchdog
- StockCharts.com, Inc.
- Candle Patterns
- Candlestick Charting Explained
- Intermarket Technical Analysis
- John Murphy on Chart Analysis
- John Murphy's Chart Pattern Recognition
- John Murphy's Market Message
- MurphyExplainsMarketAnalysis-Intermarket Analysis
- MurphyExplainsMarketAnalysis-Visual Analysis
- StockCharts.com
- Technical Analysis of the Financial Markets
- The Visual Investor
