HOT TOPICS LIST
- MACD
- Fibonacci
- RSI
- Gann
- ADXR
- Stochastics
- Volume
- Triangles
- Futures
- Cycles
- Volatility
- ZIGZAG
- MESA
- Retracement
- Aroon
INDICATORS LIST
LIST OF TOPICS
PRINT THIS ARTICLE
by Koos van der Merwe
The bubble that burst in 2007 was created by the banking industry.
Position: Buy
Koos van der Merwe
Has been a technical analyst since 1969, and has worked as a futures and options trader with First Financial Futures in Johannesburg, South Africa.
PRINT THIS ARTICLE
TECHNICAL ANALYSIS
Is It Time To Look At The Banks?
03/09/16 05:28:03 PMby Koos van der Merwe
The bubble that burst in 2007 was created by the banking industry.
Position: Buy
| The mortgage bubble of 2007 was caused by the banks in America offering home buyers cheap mortgage rates and then bundling them together. But the bubble burst and the stock market crashed. Since then the banks have struggled to regain their footing and have fallen heavily from the high prices they once held. However, when Jamie Dimon, the president and chief executive officer of JP Morgan Chase, the largest of the "Big Four" American banks, announced on February 12th that he is buying $26.6 million in JPMorgan Chase's battered shares, was he telling us something? |

|
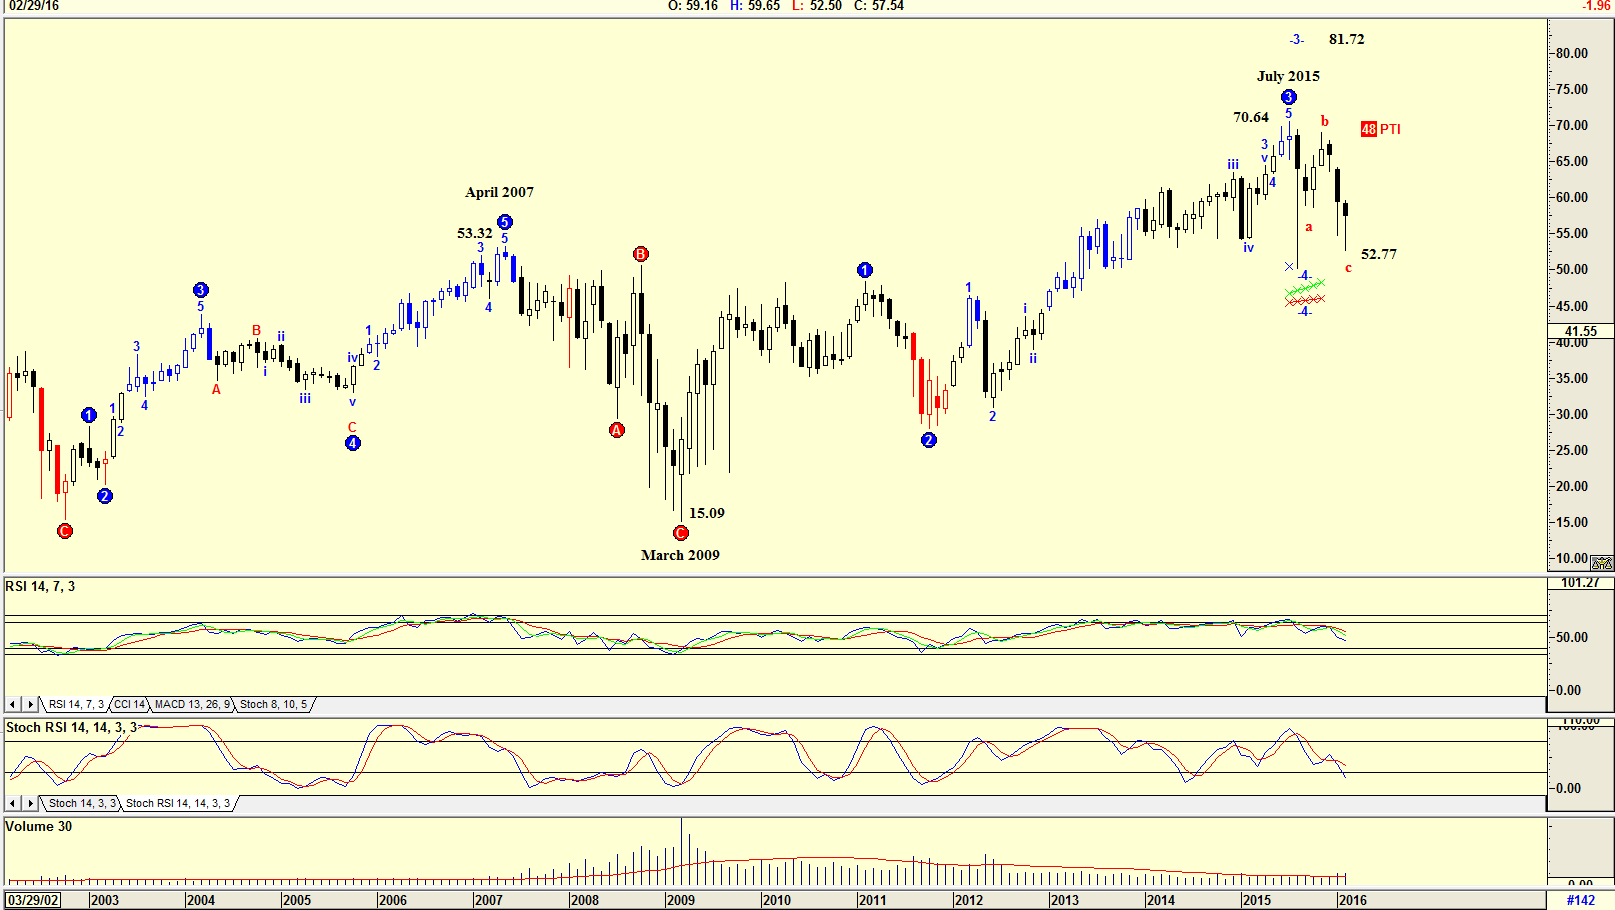
| Figure 1. Monthly chart with Elliott Wave count. |
| Graphic provided by: AdvancedGET. |
| |
| The chart in Figure 1 is a monthly chart of JPMorgan Chase showing how the share price fell from $53.32 in April 2007 to a low of $15.09 by March 2009. From that date, the share price recovered in a WAVE 3 to a high of $70.64 by July 2015. The share price has since fallen in a WAVE 4 to $52.77. Both indicators, the RSI and the Stochastic RSI, have not given buy signals, but they are approaching oversold positions. The chart is suggesting a probability (PTI) of 48% that the share price could rise to $81.72. |

|
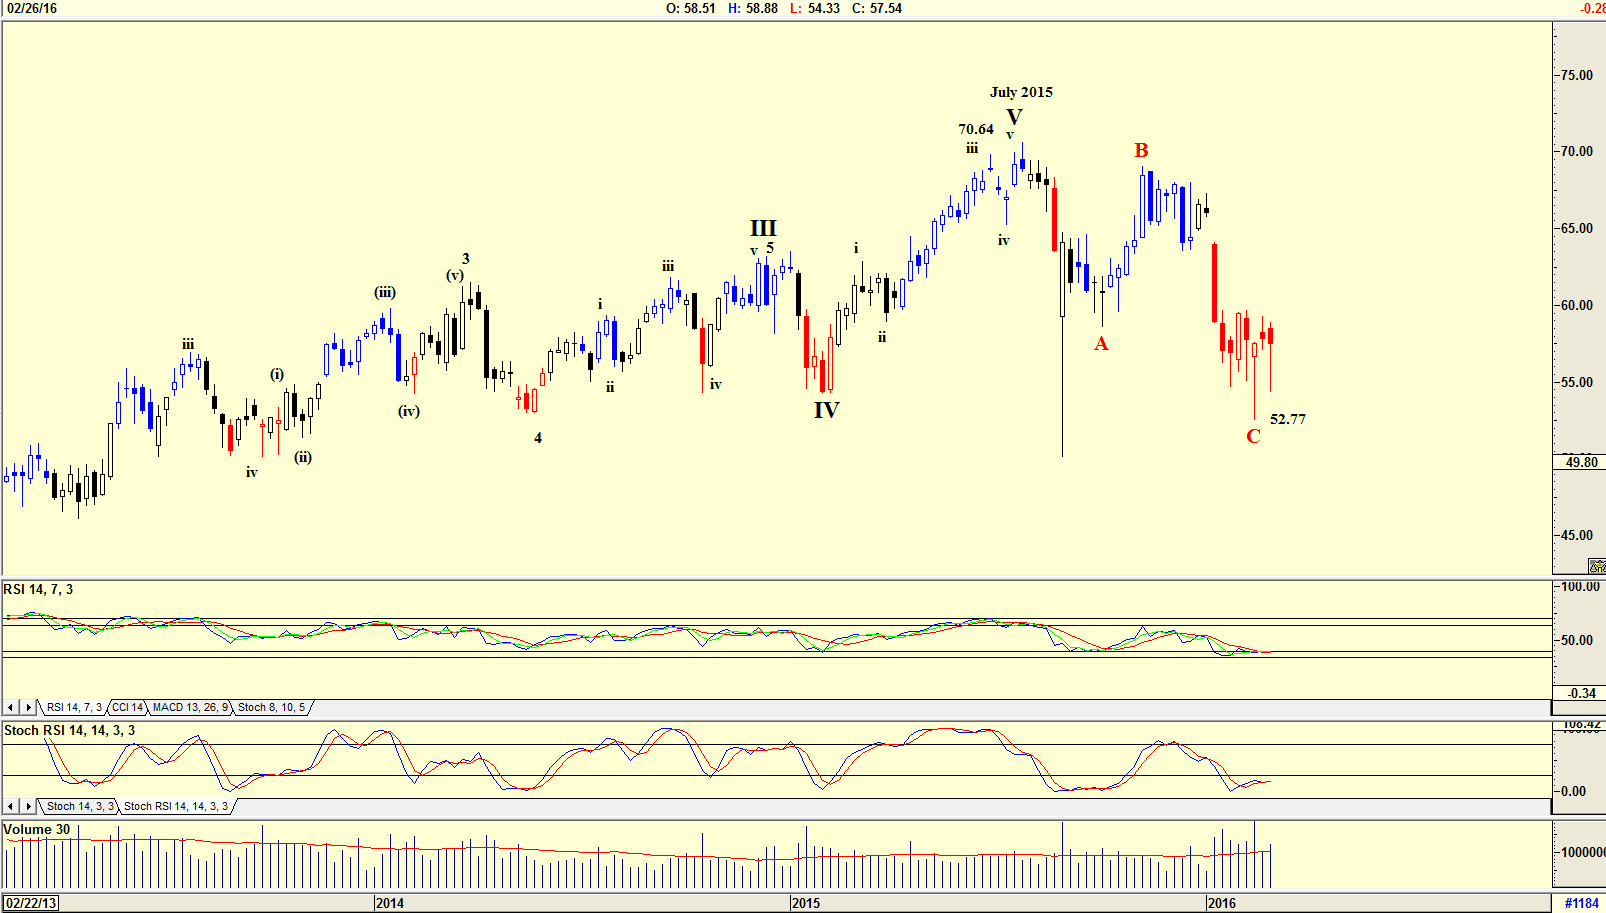
| Figure 2 Weekly chart with Elliott Wave count |
| Graphic provided by: AdvancedGET. |
| |
| The weekly chart Elliott wave count suggests that a WAVE C at $52.77 has been completed, and this is confirmed by the two indicators which are at oversold levels and suggesting a buy. The Elliott wave count is showing that a WAVE C has been completed and that the share price should start rising in a Wave 1. |

|
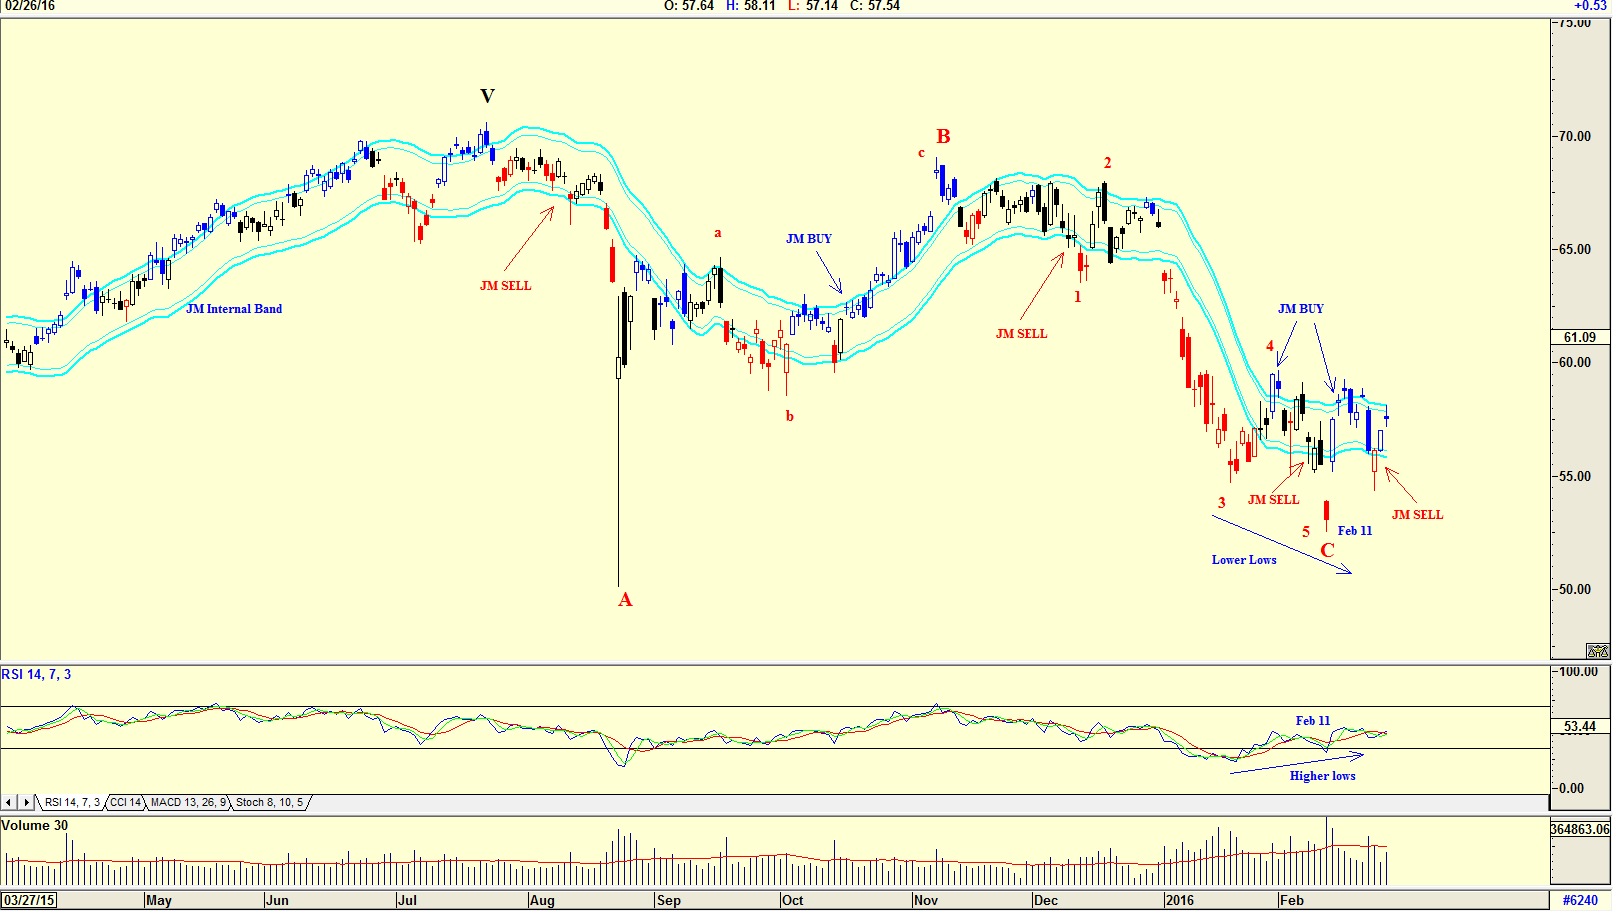
| Figure 3 Daily chart with JM Internal Band. |
| Graphic provided by: AdvancedGET. |
| |
| The chart in Figure 3 is a daily chart with an Elliott wave count showing that WAVE C is complete. The 14-period RSI indicator gave a divergence buy signal on February 11th. A divergence buy signal is where the share price makes lower lows, but the RSI indicator makes higher lows as shown on the chart. The chart also shows the JM Internal Band. A JM Internal Band is a simple 15 period moving average offset by 2% positive and 2% negative. A move above the upper band suggests a buy and a move below the lower band suggests a sell. At the moment the share price has not broken above the upper band giving a buy, but with the RSI having given a divergent buy signal, a buy on price chart could be given soon. |

|
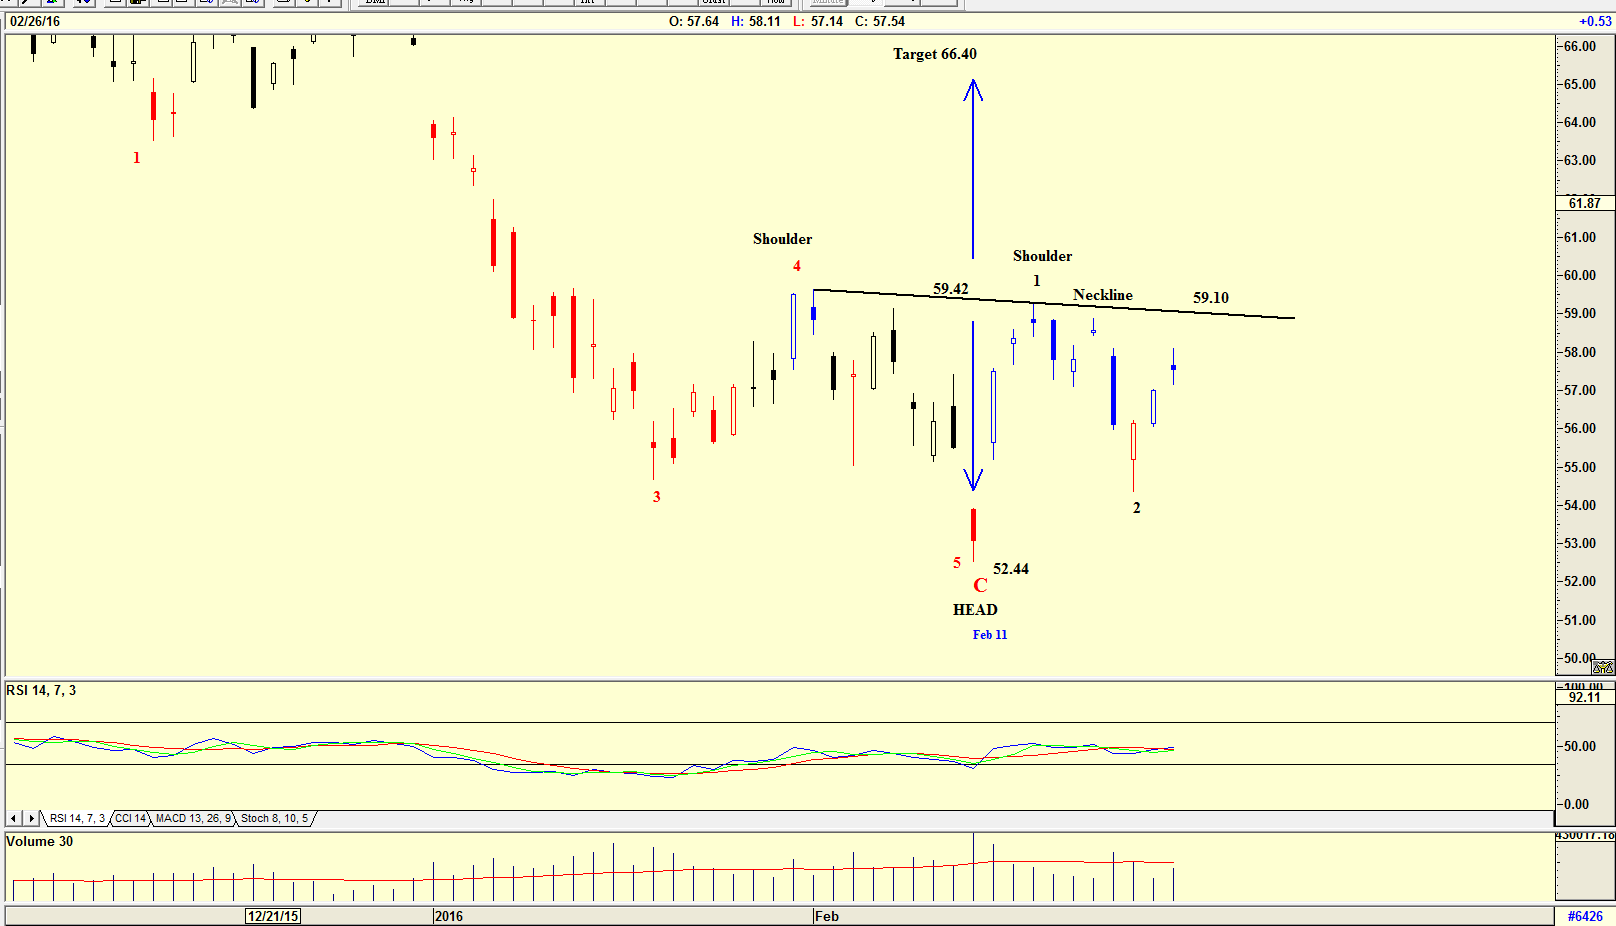
| Figure 4, Daily chart with inverted Head and Shoulders formation. |
| Graphic provided by: AdvancedGET. |
| |
| The chart in Figure 4 is a daily chart showing the inverted Head and Shoulder formation that has been made. The target suggested is $66.40 (59.42 - 52.44 = 6.98 + 59.42 = 66.40). With so many indicators suggesting a buy, it is no wonder that Jamie Dimon has bought shares with his own money, investing in a company that he has built and knows well. There is a rumor making the rounds that the big banks should be split into smaller banks. This happened in Canada, where the banks were not allowed to merge or form big banks like in the USA where Lehman Brothers went into bankruptcy in 2008. With the bursting bubble of 2007, Canadian banks were not badly hit. Buying shares in JP Morgan Chase could therefore be a wise decision. |
Has been a technical analyst since 1969, and has worked as a futures and options trader with First Financial Futures in Johannesburg, South Africa.
| Address: | 3256 West 24th Ave |
| Vancouver, BC | |
| Phone # for sales: | 6042634214 |
| E-mail address: | petroosp@gmail.com |
Click here for more information about our publications!
Comments
Date: 03/10/16Rank: 5Comment:

|

Request Information From Our Sponsors
- StockCharts.com, Inc.
- Candle Patterns
- Candlestick Charting Explained
- Intermarket Technical Analysis
- John Murphy on Chart Analysis
- John Murphy's Chart Pattern Recognition
- John Murphy's Market Message
- MurphyExplainsMarketAnalysis-Intermarket Analysis
- MurphyExplainsMarketAnalysis-Visual Analysis
- StockCharts.com
- Technical Analysis of the Financial Markets
- The Visual Investor
- VectorVest, Inc.
- Executive Premier Workshop
- One-Day Options Course
- OptionsPro
- Retirement Income Workshop
- Sure-Fire Trading Systems (VectorVest, Inc.)
- Trading as a Business Workshop
- VectorVest 7 EOD
- VectorVest 7 RealTime/IntraDay
- VectorVest AutoTester
- VectorVest Educational Services
- VectorVest OnLine
- VectorVest Options Analyzer
- VectorVest ProGraphics v6.0
- VectorVest ProTrader 7
- VectorVest RealTime Derby Tool
- VectorVest Simulator
- VectorVest Variator
- VectorVest Watchdog
