HOT TOPICS LIST
- MACD
- Fibonacci
- RSI
- Gann
- ADXR
- Stochastics
- Volume
- Triangles
- Futures
- Cycles
- Volatility
- ZIGZAG
- MESA
- Retracement
- Aroon
INDICATORS LIST
LIST OF TOPICS
PRINT THIS ARTICLE
by Kevin Hopson
The AMEX Oil Index (XOI) has been capped by its 50-day moving average since July of this year. With this moving average coming into play once again, could the XOI be setting up for a short-term top?
Position: Hold
Kevin Hopson
Kevin has been a technical analyst for roughly 10 years now. Previously, Kevin owned his own business and acted as a registered investment advisor, specializing in energy. He was also a freelance oil analyst for Orient Trading Co., a commodity futures trading firm in Japan. Kevin is currently a freelance writer.
PRINT THIS ARTICLE
TECHNICAL ANALYSIS
The AMEX Oil Index is Testing Key Resistance
11/22/02 08:31:56 AMby Kevin Hopson
The AMEX Oil Index (XOI) has been capped by its 50-day moving average since July of this year. With this moving average coming into play once again, could the XOI be setting up for a short-term top?
Position: Hold
| The AMEX Oil Index (XOI), a price-weighted index of large-cap integrated oil companies, has been in a clear downtrend since May of this year. This may come as a surprise to some, as crude oil prices appreciated significantly until October. While these companies' upstream operations (exploration and production) have benefited from higher prices, their downstream (refining) businesses have faltered, the primary reason being that higher crude oil prices have resulted in higher refining costs. Since demand for crude oil products (gasoline, heating oil, etc.) has not kept pace with rising oil prices, many integrated oil companies have been bleeding red lately. |
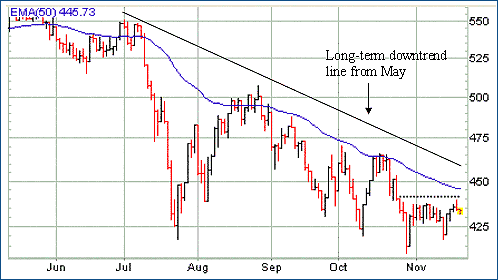
| As a result, the technical picture has remained weak. More specifically, when I touched on the XOI last month, I mentioned that the 475 level had to be taken out for the long-term trend to turn positive. As you can see in the chart, this failed to occur. In fact, the index never really tested its long-term downtrend line. The culprit was the index's 50-day moving average, which has capped prices - except on a few minor occasions - since July of this year. |

|
| Graphic provided by: Stockcharts.com. |
| |
| Looking at the chart, you will notice that the 50-day moving average is once again coming into play. However, the 50% retracement (dotted line) from the sell off in late October comes in around the 440 level. This level is acting as near-term resistance and, not coincidentally, is where the index topped out on Tuesday. As a result, if the XOI can overcome the 440 level, the next upside target would be the 446 level. |
| Unfortunately, the 446 level is not only the site of the index's 50-day moving average, but it is also the site of the 61.8% retracement level from last month's decline. When a fibonacci level coincides with a major moving average, it tends to act as a significant turning point. Though we will have to see what develops, there is a good possibility that the XOI will see a short-term top soon. The one thing that would change my mind in the near-term would be a break of the index's long-term downward trendline, which is converging around the 455 level right now. More specifically, if the index can hit 460, the long-term trend will turn positive. |
Kevin has been a technical analyst for roughly 10 years now. Previously, Kevin owned his own business and acted as a registered investment advisor, specializing in energy. He was also a freelance oil analyst for Orient Trading Co., a commodity futures trading firm in Japan. Kevin is currently a freelance writer.
| Glen Allen, VA | |
| E-mail address: | hopson_1@yahoo.com |
Click here for more information about our publications!
Comments
Date: 11/25/02Rank: 5Comment:

Request Information From Our Sponsors
- StockCharts.com, Inc.
- Candle Patterns
- Candlestick Charting Explained
- Intermarket Technical Analysis
- John Murphy on Chart Analysis
- John Murphy's Chart Pattern Recognition
- John Murphy's Market Message
- MurphyExplainsMarketAnalysis-Intermarket Analysis
- MurphyExplainsMarketAnalysis-Visual Analysis
- StockCharts.com
- Technical Analysis of the Financial Markets
- The Visual Investor
- VectorVest, Inc.
- Executive Premier Workshop
- One-Day Options Course
- OptionsPro
- Retirement Income Workshop
- Sure-Fire Trading Systems (VectorVest, Inc.)
- Trading as a Business Workshop
- VectorVest 7 EOD
- VectorVest 7 RealTime/IntraDay
- VectorVest AutoTester
- VectorVest Educational Services
- VectorVest OnLine
- VectorVest Options Analyzer
- VectorVest ProGraphics v6.0
- VectorVest ProTrader 7
- VectorVest RealTime Derby Tool
- VectorVest Simulator
- VectorVest Variator
- VectorVest Watchdog
