

HOT TOPICS LIST
- MACD
- Fibonacci
- RSI
- Gann
- ADXR
- Stochastics
- Volume
- Triangles
- Futures
- Cycles
- Volatility
- ZIGZAG
- MESA
- Retracement
- Aroon
INDICATORS LIST
LIST OF TOPICS
PRINT THIS ARTICLE
by Stella Osoba, CMT
A bear flag is often a bearish signal. Regeneration Pharmeceuticals, Inc. is just completing one - is it too early to tell what this means for the stock?
Position: N/A
Stella Osoba, CMT
Stella Osoba is a trader and financial writer. She is a frequent contributor to "Technical Analysis of Stocks and Commodities" magazine and "Traders.com Advantage" as well as other financial publications.
PRINT THIS ARTICLE
STOCKS
What Does Regeneration's Bear Flag Mean?
03/08/16 04:18:12 PMby Stella Osoba, CMT
A bear flag is often a bearish signal. Regeneration Pharmeceuticals, Inc. is just completing one - is it too early to tell what this means for the stock?
Position: N/A
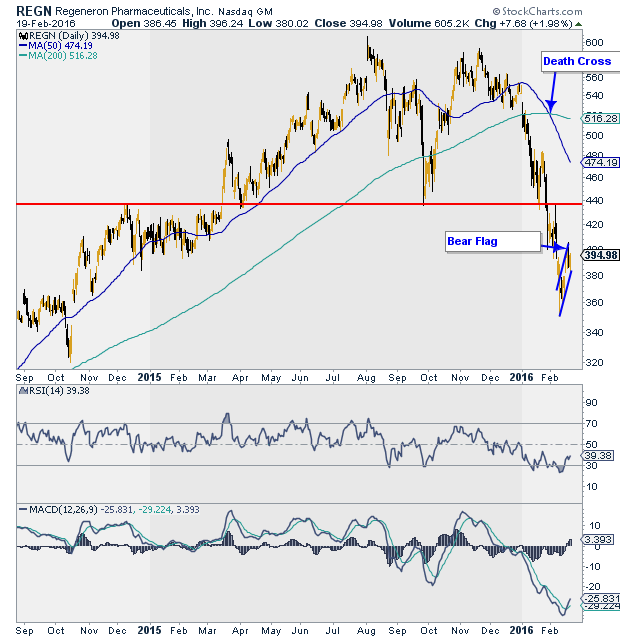
| Shares of Regeneration Pharmeceuticals, Inc., (REGN) the biopharmaceuticals company which manufactures medications such as cholesterol lowering drugs, injections for macular degeneration and medications for other serious medical conditions, had been in an uptrend since it formed a bullish reversal pattern on March 9, 2009. But that uptrend ended on August 8, 2015 when REGN formed a bearish double top reversal. It retested its highs in November and broke out to the downside after forming a bearish reversal on November 23, 2015. Its shares have been in a downtrend ever since. The question now is, do the technicals show signs of a possible bottom and reversal or is the downtrend set to continue? |
| On February 9, 2015, REGN hit lows of 350 for a loss of about 40% from its high. It has since turned up, but looks to be forming what could possibly be a bull channel which is a bear flag (see figure one). This means that a further breakout to the downside is possible. REGN could see more lows or at the least retest the low of February 9, 2015. However, it is important to note that not all bear flags break out to the downside so a stop on a short should be above the upper trend channel line. A bear flag could break above the upper channel trend line, it could meander back to the middle of the channel and possibly stay in a trading range or it could breakout to the downside. Wait for price action to confirm. |
|
| Figure 1: Daily chart for REGN. |
| Graphic provided by: StockCharts.com. |
| |
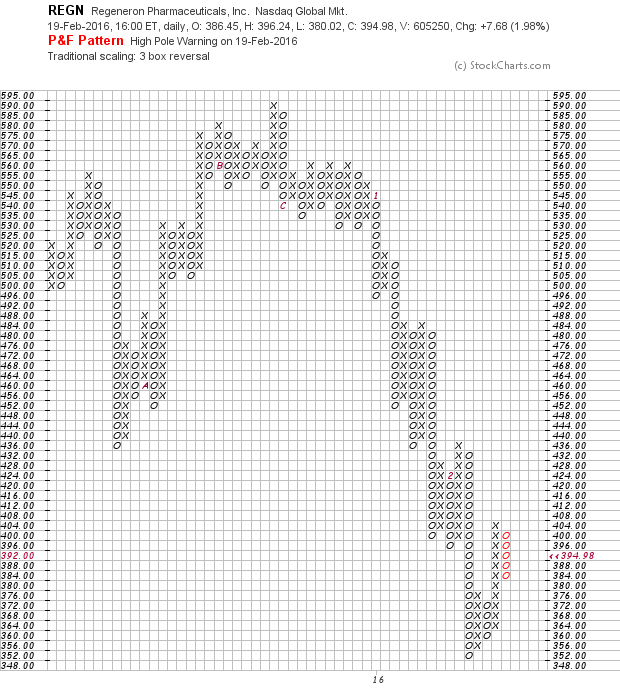
| The P&F chart shows a high pole warning which is another bearish sign (see Figure 2). The bearish death cross is still in effect with the 200 day moving average above the 50 day moving average. The RSI is in bearish territory, turning up from 30. Even though the MACD line is just above the signal line and is turning up, it is way below the 0 line. |
|
| Figure 2: P&F chart for REGN. |
| Graphic provided by: StockCharts.com. |
| |
| A follow through of the February 19, 2016 bull move with a strong bull candle breaking the upper trend channel line is possible. But a break above 438 would be an even more positive reversal signal. |
Stella Osoba is a trader and financial writer. She is a frequent contributor to "Technical Analysis of Stocks and Commodities" magazine and "Traders.com Advantage" as well as other financial publications.
| E-mail address: | stellaosoba@gmail.com |
Click here for more information about our publications!
PRINT THIS ARTICLE

Request Information From Our Sponsors
- StockCharts.com, Inc.
- Candle Patterns
- Candlestick Charting Explained
- Intermarket Technical Analysis
- John Murphy on Chart Analysis
- John Murphy's Chart Pattern Recognition
- John Murphy's Market Message
- MurphyExplainsMarketAnalysis-Intermarket Analysis
- MurphyExplainsMarketAnalysis-Visual Analysis
- StockCharts.com
- Technical Analysis of the Financial Markets
- The Visual Investor
- VectorVest, Inc.
- Executive Premier Workshop
- One-Day Options Course
- OptionsPro
- Retirement Income Workshop
- Sure-Fire Trading Systems (VectorVest, Inc.)
- Trading as a Business Workshop
- VectorVest 7 EOD
- VectorVest 7 RealTime/IntraDay
- VectorVest AutoTester
- VectorVest Educational Services
- VectorVest OnLine
- VectorVest Options Analyzer
- VectorVest ProGraphics v6.0
- VectorVest ProTrader 7
- VectorVest RealTime Derby Tool
- VectorVest Simulator
- VectorVest Variator
- VectorVest Watchdog