HOT TOPICS LIST
- MACD
- Fibonacci
- RSI
- Gann
- ADXR
- Stochastics
- Volume
- Triangles
- Futures
- Cycles
- Volatility
- ZIGZAG
- MESA
- Retracement
- Aroon
INDICATORS LIST
LIST OF TOPICS
PRINT THIS ARTICLE
by Koos van der Merwe
If the bear market becomes a reality, should you invest in gold?
Position: Sell
Koos van der Merwe
Has been a technical analyst since 1969, and has worked as a futures and options trader with First Financial Futures in Johannesburg, South Africa.
PRINT THIS ARTICLE
TECHNICAL ANALYSIS
Going For Gold
03/02/16 11:26:13 AMby Koos van der Merwe
If the bear market becomes a reality, should you invest in gold?
Position: Sell
| The are so many expert investment advisors out there calling for a bursting bubble in the stock market. The question on everyone's mind is, where do you put your money to protect your investment? The US$ has strengthened over the past year, but one of these days it could start weakening, especially as the Presidential election in the US comes to an end and a new President takes office with fresh ideas on managing the economy. Many investors believe that putting their money into gold is the answer. Whether it is buying physical gold coins or buying gold ETFs listed on the stock market, that is the question. Buying gold mining shares is another thought, because as gold rises in value, so their profitability increases. Whatever the answer, one should always keep in mind the value of the currency the gold price/share is quoted in. With the US$ probably starting to weaken against other currencies, investing in Canadian gold ETFs may be the way to go. |

|
| Figure 1. Quarterly chart of the London Gold price. |
| Graphic provided by: MetaStock. |
| |
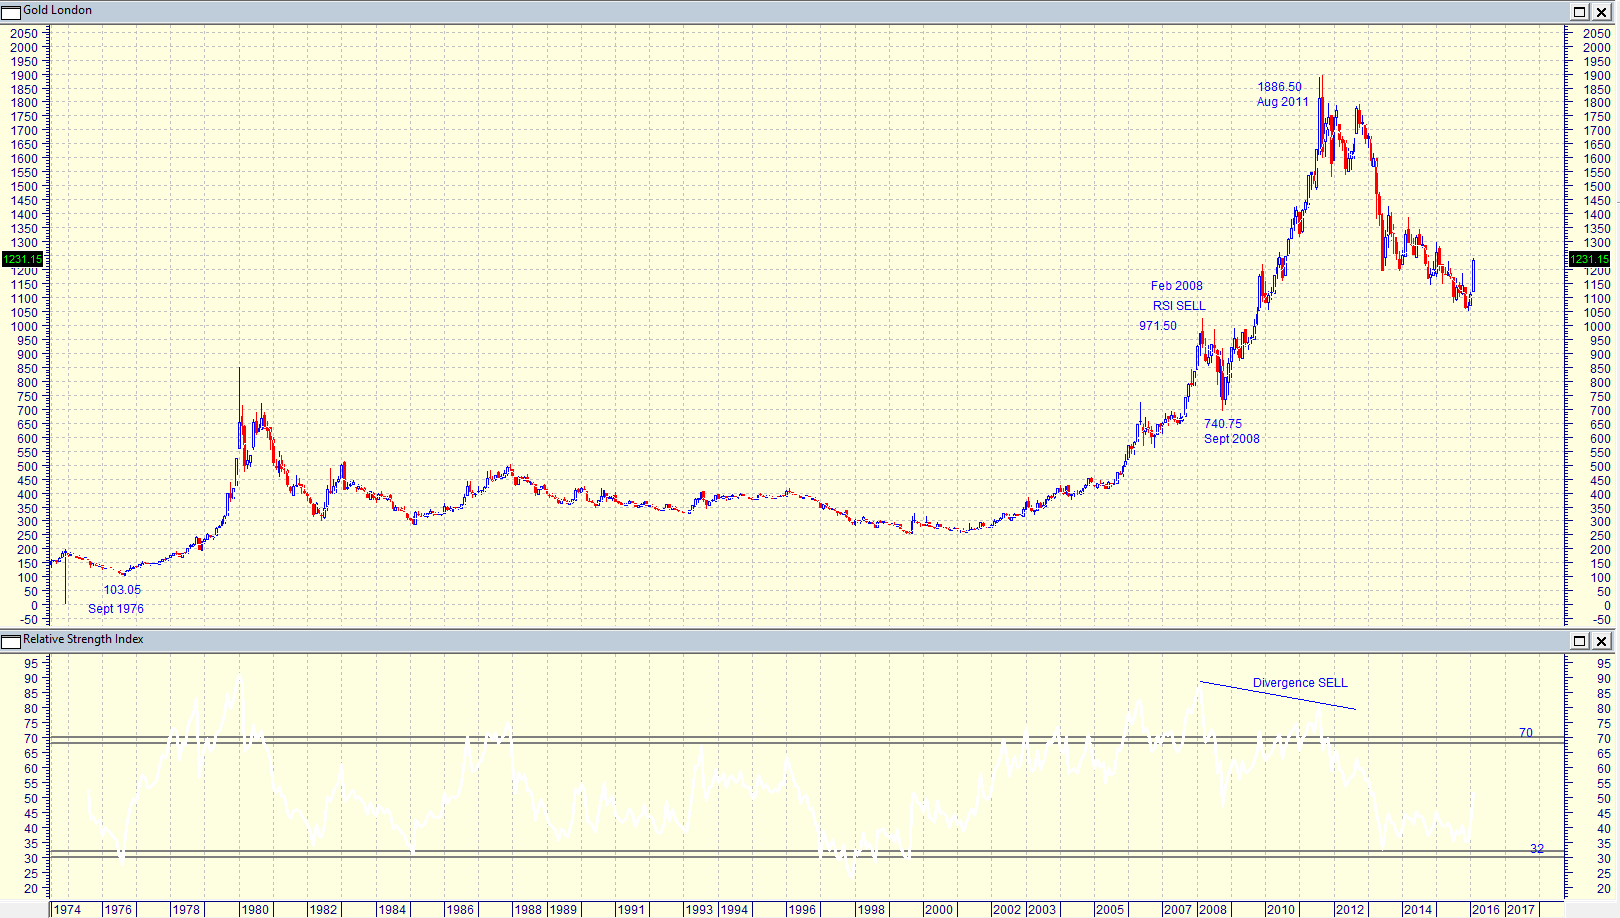
| The chart in Figure 1 is a chart of the gold price and shows how the price moved from a low of $103.05 in September 1978 to the high of $1886.50 by August 2011. The RSI indicator shown on the chart gave a sell signal on February 2008 when the price was $971.50. The price dropped to $740.75 by September 2008 but then continued rising to $1886.50 when the RSI indicator suggested a divergent SELL. The chart shows that the RSI indicator has not suggested a BUY although it tested the 32 horizontal. Another indicator not shown on the chart, may possibly have suggested a buy. So, with the chart now showing the gold price rising, and the RSI indicator starting to rise, perhaps that is the way to go. |

|
| Figre 2. Weekly Chart of the ETF, Spider Gold Shares, on the TSX. |
| Graphic provided by: AdvancedGET. |
| |
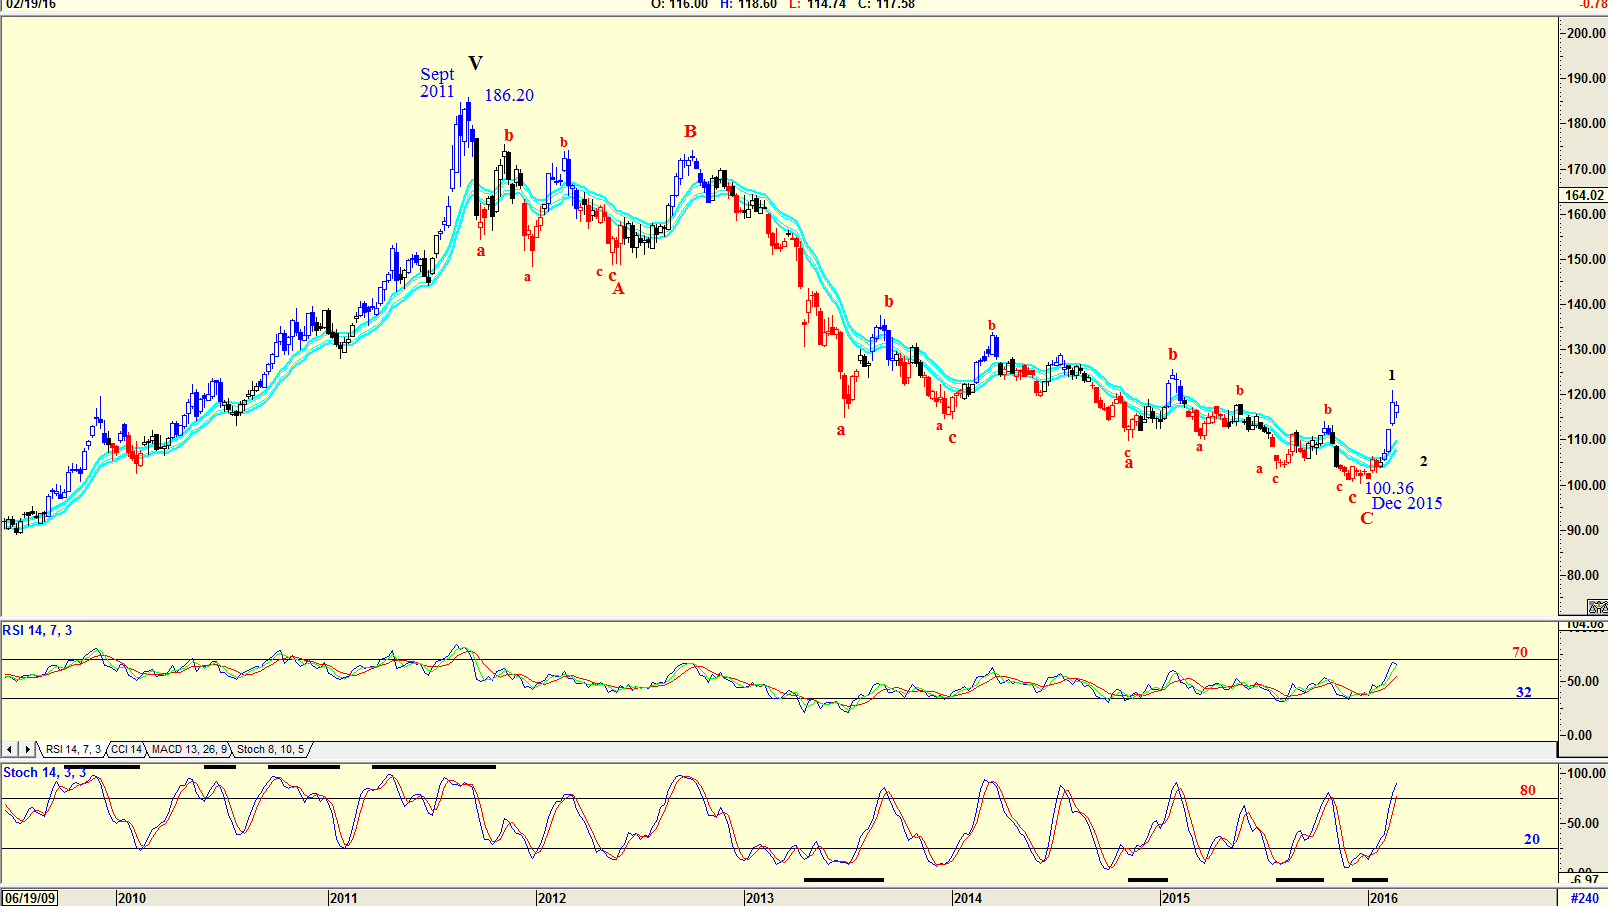
| The chart in Figure 2 is a chart of the Spider Gold Shares ETF as listed on the Canadian Stock Exchange. It is a weekly chart and shows how the ETF fell from a high of $186.20 on September 2011 to a low of $100.36 by December 2015. Do not forget that these prices are in C$, so a US resident would score well on the present currency exchange rate. However, do note the two indicators. The RSI 14 indicator is trending upwards and is approaching the horizontal 70 line. The Stochastic 14 is at overbought levels and could give a sell signal in the near future. However, the Elliott wave count is suggesting the completion of a WAVE C correction. If this is true then the price has risen in a wave 1, and the correction, when it occurs, will be a wave 2 which can be as great as a 70% correction of the rise of wave 1. |

|
| Figure 3. Daily chart of the StreetTRACKS Gold Share ETF, with an Elliott wave count. |
| Graphic provided by: AdvancedGET. |
| |
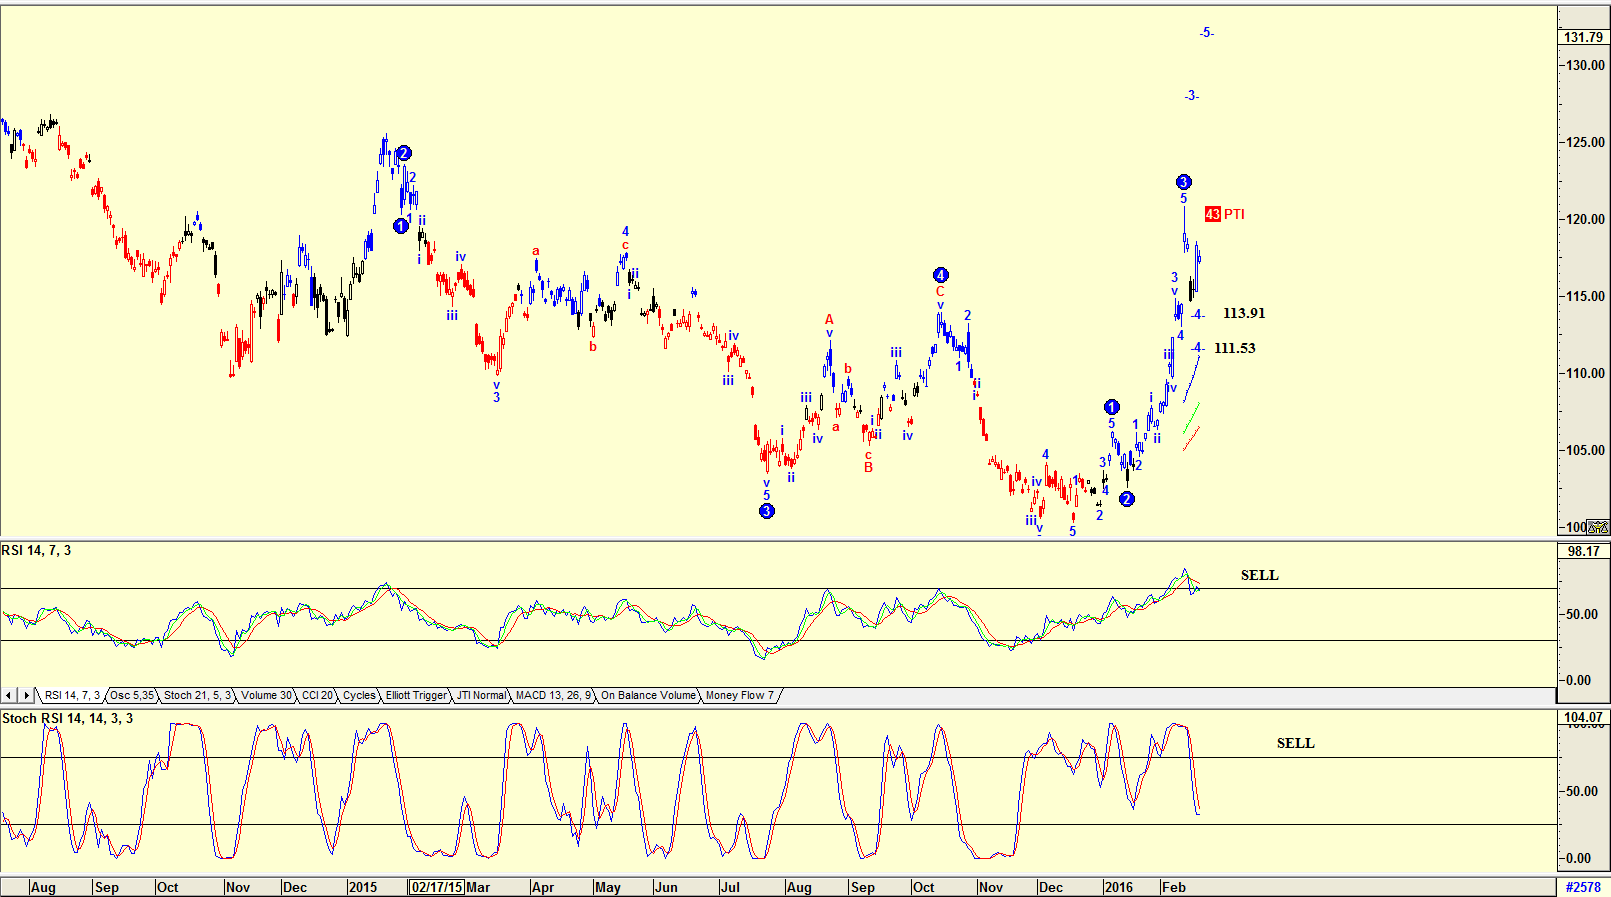
| The chart in Figure 3 is a daily chart of the StreetTRACKS Gold share ETF quoted on the US stock market. An Elliott wave count suggests that a Wave 3 is complete and that the ETF could fall in a wave 4 to either 113.91 or 111.53. The PTI indicator (probability indicator), at 43, suggests that there is a 43% chance that this could occur. Both the RSI indicator and the Stochastic RSI indicator have given sell signals, suggesting that the fall may well occur. The two ETF charts, Canadian and US, suggest that the gold price could possibly weaken. This does present an opportunity to buy the ETFs sometime in the future. The Elliott wave count, suggesting that they could possibly be in a Wave 2 correction and that the Wave 3 that will follow could suggest a sound investment for the long term. |
Has been a technical analyst since 1969, and has worked as a futures and options trader with First Financial Futures in Johannesburg, South Africa.
| Address: | 3256 West 24th Ave |
| Vancouver, BC | |
| Phone # for sales: | 6042634214 |
| E-mail address: | petroosp@gmail.com |
Click here for more information about our publications!
PRINT THIS ARTICLE

Request Information From Our Sponsors
- StockCharts.com, Inc.
- Candle Patterns
- Candlestick Charting Explained
- Intermarket Technical Analysis
- John Murphy on Chart Analysis
- John Murphy's Chart Pattern Recognition
- John Murphy's Market Message
- MurphyExplainsMarketAnalysis-Intermarket Analysis
- MurphyExplainsMarketAnalysis-Visual Analysis
- StockCharts.com
- Technical Analysis of the Financial Markets
- The Visual Investor
- VectorVest, Inc.
- Executive Premier Workshop
- One-Day Options Course
- OptionsPro
- Retirement Income Workshop
- Sure-Fire Trading Systems (VectorVest, Inc.)
- Trading as a Business Workshop
- VectorVest 7 EOD
- VectorVest 7 RealTime/IntraDay
- VectorVest AutoTester
- VectorVest Educational Services
- VectorVest OnLine
- VectorVest Options Analyzer
- VectorVest ProGraphics v6.0
- VectorVest ProTrader 7
- VectorVest RealTime Derby Tool
- VectorVest Simulator
- VectorVest Variator
- VectorVest Watchdog
